Smart Alerts
Smart Alerts provide you with automatically generated alerting configurations, so you can receive alerts based on out-of-the-box blueprints such as website slowness, JavaScript errors, and HTTP status codes.
Select a blueprint that you would like to be alerted for, choose an arbitrary scope, for example, by geolocation, browser, OS, and so on, and the system automatically creates a tailored alert for you.
Adding an alert
You can add an alert by completing the following steps:
- On the sidebar, click Websites.
- Click the name of your website and then click Add Alert.
Simple mode
By default, you create an alert in the simple mode, which involves the following steps:
- Select an alert.
- Confirm your scope.
- Select an alert channel.
Simple mode: You can select alerts with zero configuration so that you don't need to create queries or define thresholds.
To create an alert in advanced mode, which investigates and modifies any automatically configured alert setting, click Switch to advanced mode.
Select an alert
Select one of the following predefined blueprints to create an alert.
| Blueprint | Description |
|---|---|
| JS Errors | Click Select JS Error to select an existing JavaScript error message that you want to be alerted for. Alternatively, you can choose the error message by providing a JavaScript message pattern by using equal, contain, starts with, or ends with a defined string. |
| Slowness | Select Slowness to receive alerts when the onLoad time or HTTP latency exceeds expectations based on historical data. The onLoad time metric exists for each page load and tracks the time until the navigation is complete. For example, when the loading indicator of the browser is stopped. The HTTP latency metric tracks the time consumed by an Ajax request. For more information about onLoad time and related metrics, see the Website monitoring FAQ. |
| HTTP Status Codes | Select a specific HTTP Status Code that you would like to be alerted for when they occur more often than usual. |
| Throughput | Select Unexpectedly Low Number of Page Loads or Unexpectedly High Number of Page Loads to receive alerts when the expected number of page loads of your website significantly differs compared to the available historical data. A page load is defined by the retrieval of the initial HTML document and all subsequent actions until the next navigation in the browser. |
| Custom Events | Select a specific Custom Event to receive an alert when it occurs more or less often than it should. |
Confirm your scope
The scope, your current open website, is automatically selected. By applying the Unbounded Analytics queries, you can further scope the alert to a specific subset of website traffic, for example, by geolocation, browser, or user.
Each query filter connects with the AND logic operator by default. Therefore, a website beacon needs to match all the filters applied:
- Specific pages.
- Browser types.
- Operating systems.
- Countries.
- Meta: specify more metadata that you can use to annotate page loads. Select one of the available keys, a predefined value, and then select an operator.
Add alert channels
To add alerts channels, click Select Alert Channel, and select the channels to send the alerts. In Smart Alerts for websites, you can add different alert channels for warning and critical severities. In simple mode, the system automatically assigns the selected channels the default severity level. The default severity level is warning. For more information about creating channels, see Alert channels.
Advanced mode
To have a full understanding and control over your alerts, advanced mode helps you to inspect the configuration of each preconfigured alert and modify if required. In addition to the selections available in simple mode, the advanced mode offers the following.
Trigger
Select one of the following predefined blueprints that you want to be alerted.
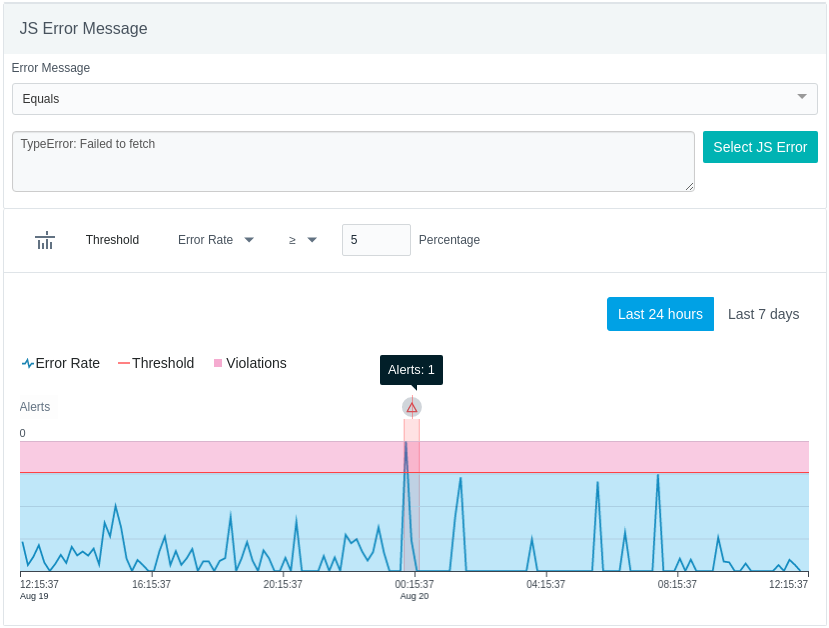
JS errors
The same configuration options are available as in simple mode. For more information, see Select an alert.
In addition, you can select which metric is used for an alert evaluation; errors rate or errors count. Whichever metric you select, Instana automatically derives a threshold value based on the past 4 weeks of data, which can also be modified.
The following image shows configuring alerts for JS errors:
Slowness
The same configuration options are available as in simple mode. For more information, see Select an alert.
In addition, you can select which metric is used for alert evaluation, such as onLoad time or HTTP latency. You can also select which percentile metric is used for alert evaluation. An alert is triggered when the percentage of website page loads, with the onLoad time less than the threshold, is less than the corresponding percentile number.
Depending on the amount of available historical data, Instana suggests a static or a dynamic baseline. Also, you can choose between a daily or weekly seasonality baseline when sufficient data is available.
The static baseline value can be directly modified. Daily or weekly seasonality can be tuned by using the sensitivity parameter, which defines how many outliers can deviate from the expected value before it is considered a violation.
The following image shows configuring alerts for slowness:

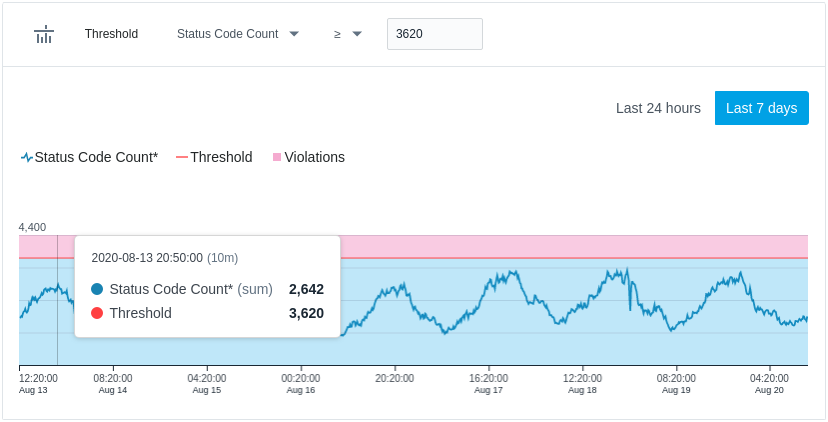
HTTP status codes
The same configuration options are available as in simple mode. For more information, see Select an alert.
Also, you can also select which metric is used for alert evaluation; status code count or status code rate. Whichever metric you select, Instana recommends a threshold value based on historical data that can be modified.
The following image shows configuring alerts for HTTP status codes:
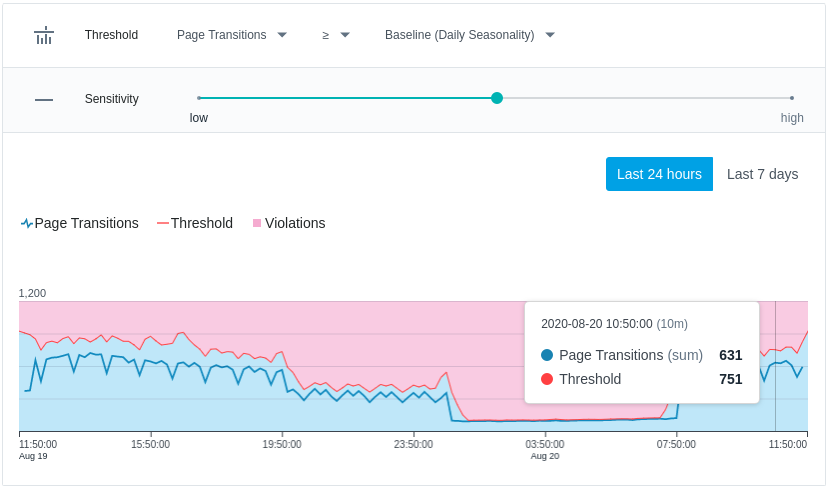
Throughput
In contrast to the use-case specific options in simple mode that is described in Select an alert, the advanced mode defines a more generic Smart Alert based on any page view related metric.
In addition, you can select which metric is used for alert evaluation, such as Page Loads or Page Transitions. More details about the available metrics can be found in the website Monitoring FAQ. Given the example configuration in the image, an alert is triggered when the number of page transitions is higher than usual. Depending on the amount of available historical data, Instana suggests a static or a dynamic baseline. Also, you can choose between a daily or weekly seasonality baseline when sufficient data is available.
The static baseline value can be directly modified. Daily or weekly seasonality can be tuned by using the sensitivity parameter, which defines how much outliers can deviate from the expected value before it is considered a violation.
The following image shows configuring alerts for page transitions:
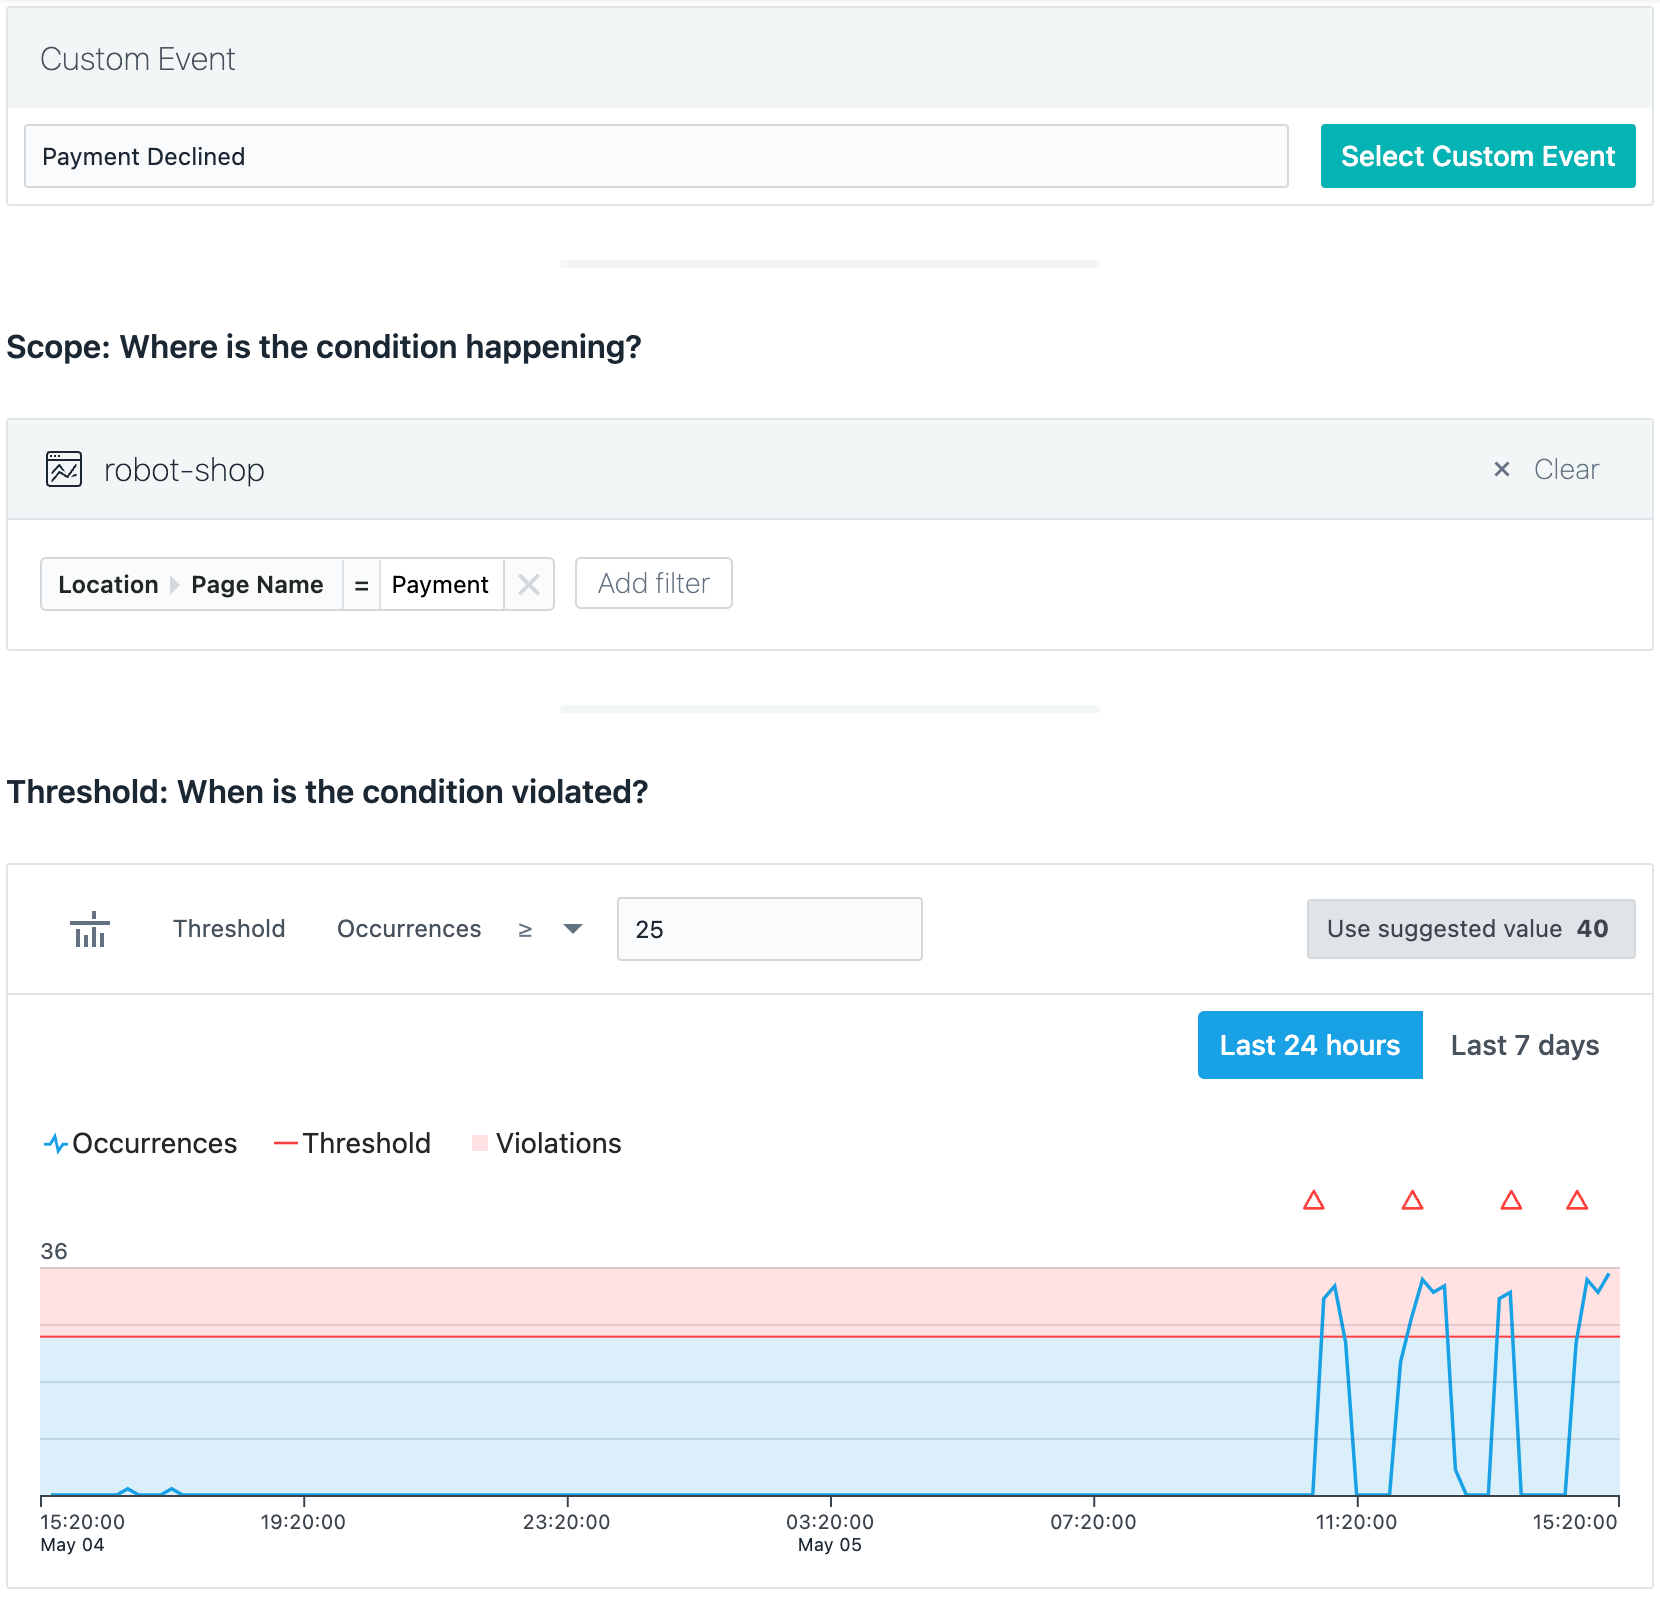
Custom Events
The same configuration options are available as in simple mode. For more information, see Select an alert.
The following image shows configuring alerts for custom events:
Type of Threshold
When you set up a Smart Alert, you can choose to use static or adaptive thresholds.
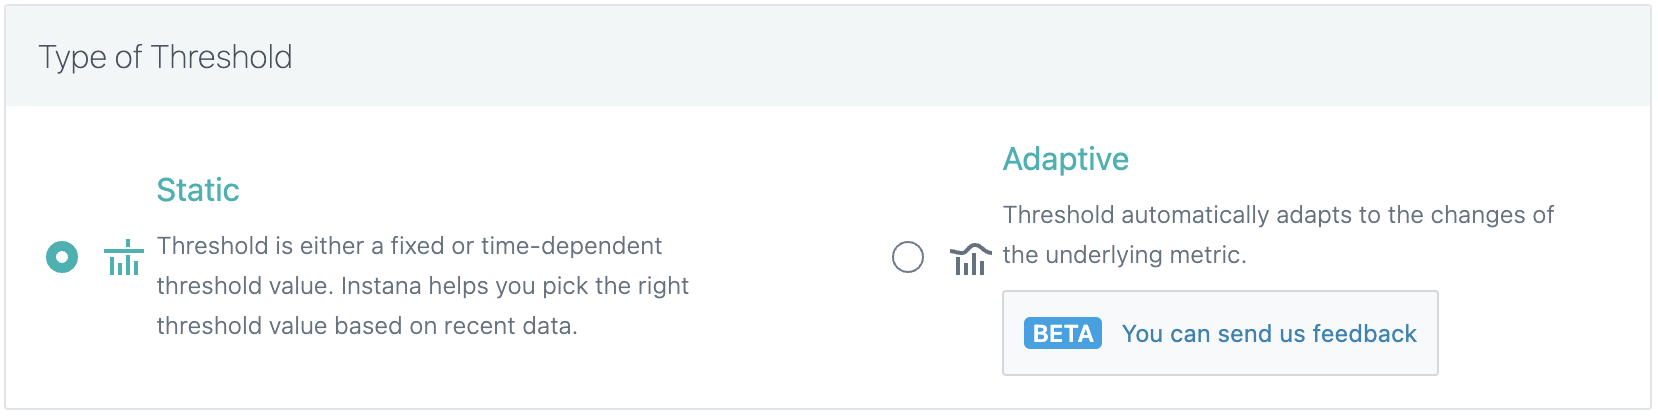
Static
Static thresholds do not change after the Smart Alert is created. The threshold itself can be either a simple constant value, or can account for seasonal variations that occurred in the past at the time of creation of the Smart Alert configuration. You can imagine the later one as a lookup table for every point in time of the day or week that is precomputed once based on historic data.
The threshold might be no longer relevant after the underlying metric is changed significantly. In response, the threshold can be manually adjusted or recalculated at any point in time.
When to use static threshold
Static thresholds work best for blueprints like Slowness or JS Errors in the following situations:
- Irrespective of any seasonality of the underlying metric. It is undesirable for the metric to go larger than or lower than a constant value.
- Therefore, the underlying metric is seasonal, and different thresholds exist depending on the point in time of the day or week. But these thresholds themselves don't change over time, and gradual changes to these thresholds over long periods of time is undesirable.
Adaptive
Adaptive thresholds continuously evolve and adjust themselves with new data that is observed by Instana. The threshold continuously accounts for seasonal changes to the underlying metric without any human intervention. For more information, see the adaptive threshold documentation.
When to use adaptive threshold
Adaptive thresholds work best for blueprints such as Throughput or generally for the following situations:
- The underlying metric is not seasonal. The threshold is expected to gradually change over time, but any sudden deviation from this trend is undesirable.
- The underlying metric is seasonal and different thresholds exist for different times of the day or week. The thresholds themselves are expected to gradually change over time, but any sudden deviation from this trend is undesirable.
Scope
The same configuration options are available as in simple mode. For more information, see Confirm your scope.
Alert threshold
You can configure the alert threshold of the Smart Alert. The underlying metric is an aggregation of beacons that relate to the given Website. When the alert threshold of the Smart Alert is configured, the alert preview of the dialog shows the metric, threshold, and the violations on historic data for the last 24 hours or 7 days.
Choose a metric
This step is relevant when you choose the Slowness blueprint, where the following options are available to choose from: arithmetic mean, minimum, and maximum, along with 25th, 50th, 75th, 90th, 95th, 98th, and 99th percentiles.
Choose a threshold operator
Based on the chosen blueprint, you have the option between <, <=, >, >=.
Choose a threshold type
Here you can choose among the following static threshold types:
- Static Threshold: Takes a constant value as the threshold.
- Static Daily Seasonality: Uses a threshold that captures the daily repeating patterns of the metric where every day behaves roughly the same, but is different throughout the day. As an example, a website that has more traffic during the day compared to during the evening.
- Static Weekly Seasonality: Uses a threshold that captures the weekly repeating patterns of the metric where every day of a week behaves roughly the same, but is different throughout the week. As an example, a website that has more traffic on workdays compared to the weekend.
For Static Daily Seasonality, at least 5 days of continuous metric data is required, but 7 days of data is recommended. For Static Weekly Seasonality, at least 2 weeks of continuous historic metric data is required. The Smart Alert cannot be created when these requirements are not met.
For Adaptive Threshold, at least 5 days of continuous metric data is required. If this requirement is not fulfilled, the Smart Alert can still be created. Issue detection and alerting will start working as soon as the data requirement is met to initialize the used model.
Choose a threshold value or sensitivity
If you choose Static Threshold, you can either use the suggested threshold value or define the value manually.
Adjust the sensitivity to refine the anomaly detection boundaries. As a consequence, you receive more alerts. However, if you want to receive fewer alert notifications, you can decrease the sensitivity. This effectively extends the detection boundaries that define the expected value range of the metric. Depending on the used threshold operator, a metric that exceeds either the upper or lower detection boundary is considered a violation that might cause an alert.
Time threshold
So that the alert is triggered, the time threshold imposes more conditions on how the defined threshold on the metric is violated.
The following typical conditions, often used in practice, are offered:
-
Persistence of time: Select a time window. When the metric violates a defined threshold over the defined time window, you are alerted.
-
The number of violations over time: Select a time window and the number of violations. When the metric violates the threshold a specified number of times during the time window, you are alerted.
-
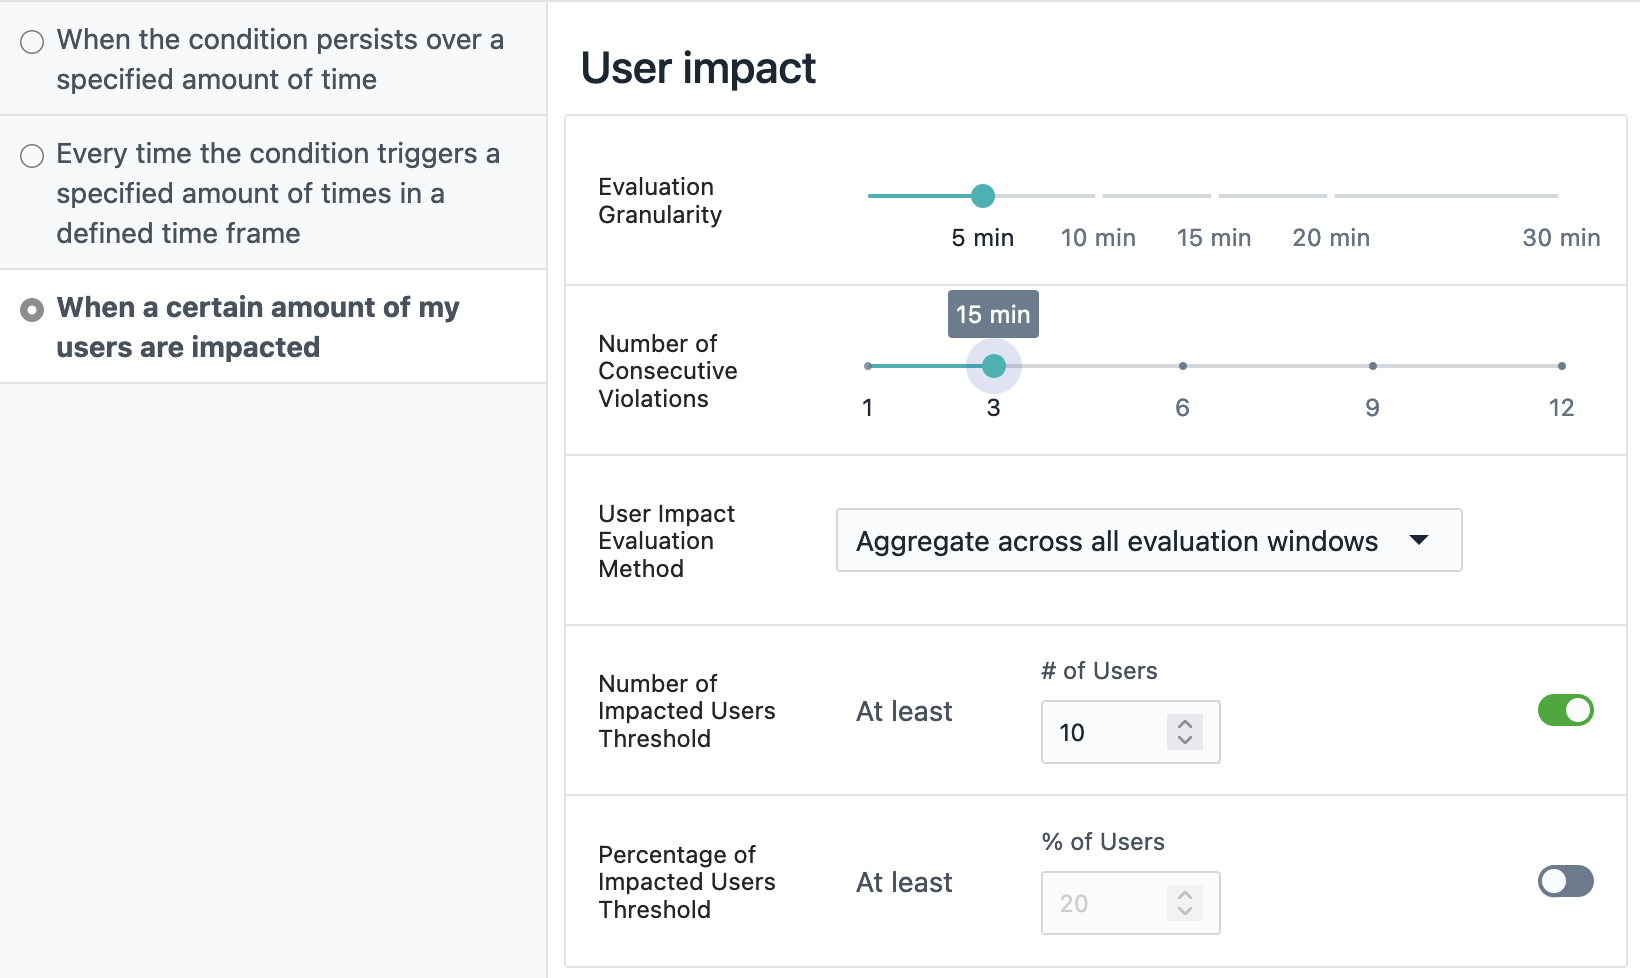
User impact:
Besides, the thresholding condition on the selected metric, you can define a secondary criterion on the minimum required impacted users. This receives alerts only in case a significant number or ratio of users are impacted by the defined problem.
- User Impact Evaluation method: Defines how the user impact is measured when the primary metric is violated for the amount of evaluation windows. You can select one of the following methods:
- Aggregate across all evaluation windows, which measures the user impact as a single aggregate across the defined time window. This value needs to be exceeded to receive an alert.
- Calculate for each evaluation window, which measures user impact for each evaluation window individually, like any other metric. To receive an alert, the defined number of evaluation windows need to be violated in sequence for both the primary metric and the user impact.
- Number of impacted users or percentage of impacted users: Specify either the absolute number of users impacted, the percentage of users impacted, or both. In the latter case, you get alerted only when both limits are reached during the defined time window.
The user impact metric requires Instana's Users API to identify authenticated users and Session API to approximate other users based on their session. Depending on the integration of these APIs, the user ID is used if provided, otherwise the session ID as a fallback.
- User Impact Evaluation method: Defines how the user impact is measured when the primary metric is violated for the amount of evaluation windows. You can select one of the following methods:
In the presence of gaps for a metric that is not SUM aggregated, such as latency or error-rates, Instana preserves the current alert state until the next metric value is seen. This behavior is helpful in case a Smart Alert is defined for a website that receives only infrequent traffic, but suffers from a persistent problem. Therefore, these periods without any website traffic will not cause repetitive alerts. However, the absence of a single website beacon for more than 3 hours cause any active alert to be closed in any case.
The following image depicts an example of a configuration for a time threshold based on user impact. Using a metric evaluation granularity of 5 minutes, an alert is triggered when at least 10 users are impacted within the last 15 minutes.
Alert channels
You can choose the alert channels to send the alert notifications. In Smart Alerts for websites, you can configure different alert channels for both warning and critical severities.
If a threshold value is set for warning and critical severities, you can set the alert channels for each severity. If a threshold value is set for both severities, all the alert channels are selected for the warning severity by default.
The following image shows alert channels with both severities configured:

If a threshold value is set only for one severity, the severity is displayed for every alert channel as the Alert Level.
The following image shows alert channels with one severity configured:

Alert properties
Adding more alert properties is optional. These options include editing the default alert title and description, placeholders to create dynamic titles and descriptions, and selecting whether the alert triggers an incident. For more information, see Alerting.
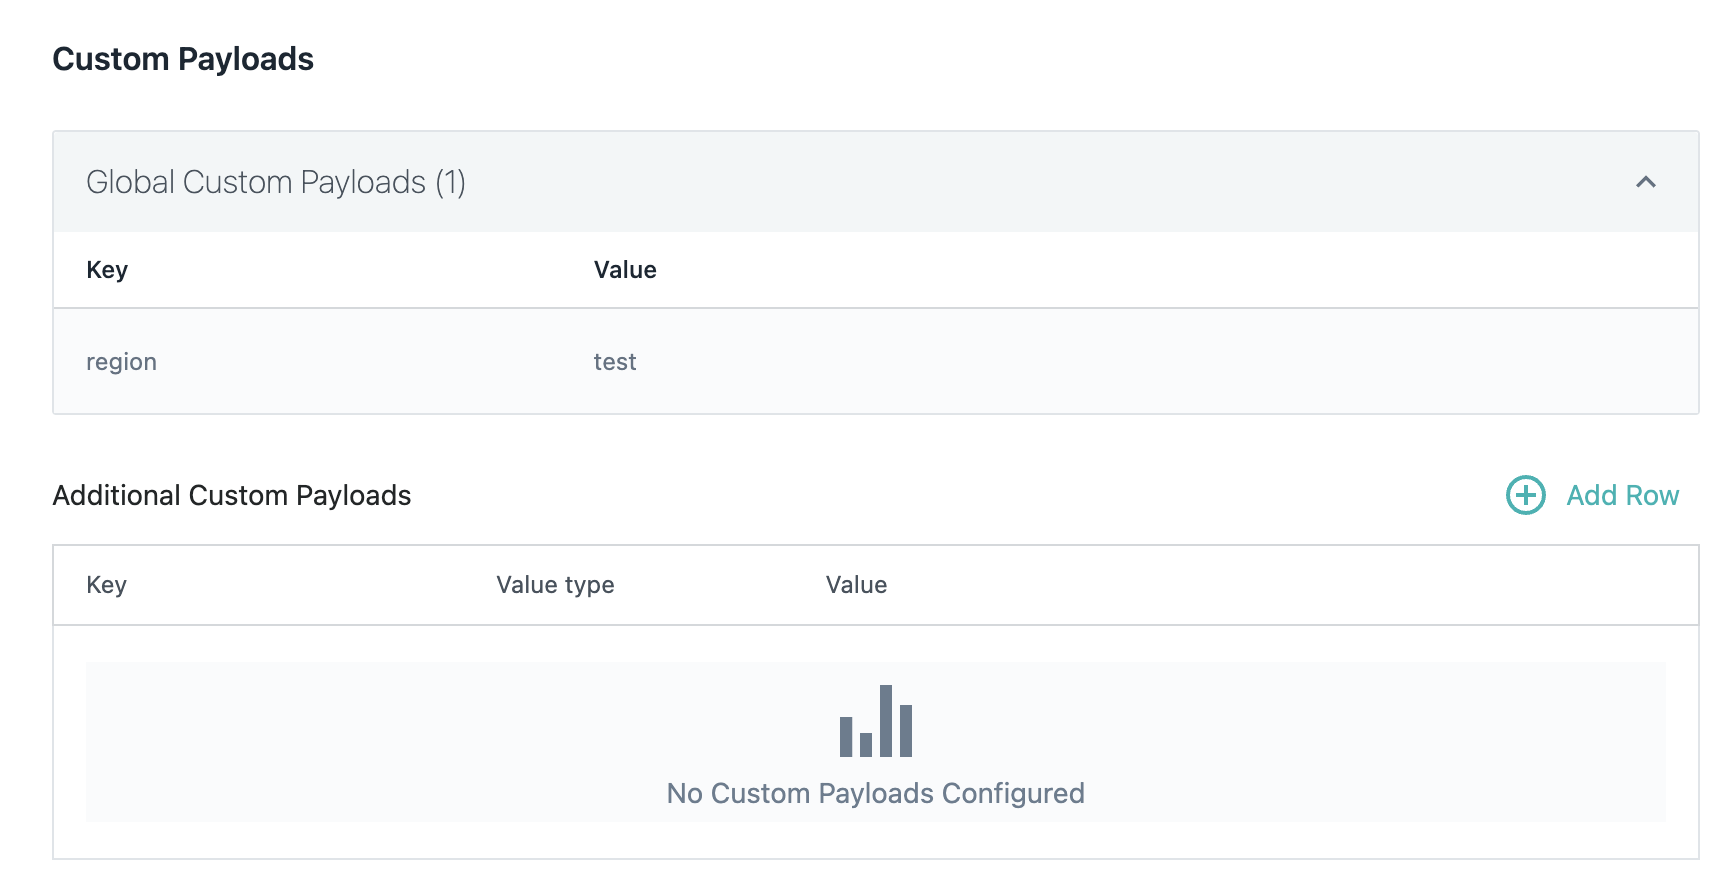
Custom payloads
To include an additional payload that is relevant to you in alert notifications for specific alert configuration that is sent by Instana click Add Row in the Custom Payloads section.
For more information, see: Configure Custom Payload Globally.
Both global custom payload and alert-specific custom payload will be included in alert notifications if applicable, but the alert-specific configuration has priority over the global configuration. As a result, if using the same key, the value of the global custom payload field will be overridden by the alert-specific one.
You can see the globally defined custom payloads that are effectively used in the alert configuration as follows:
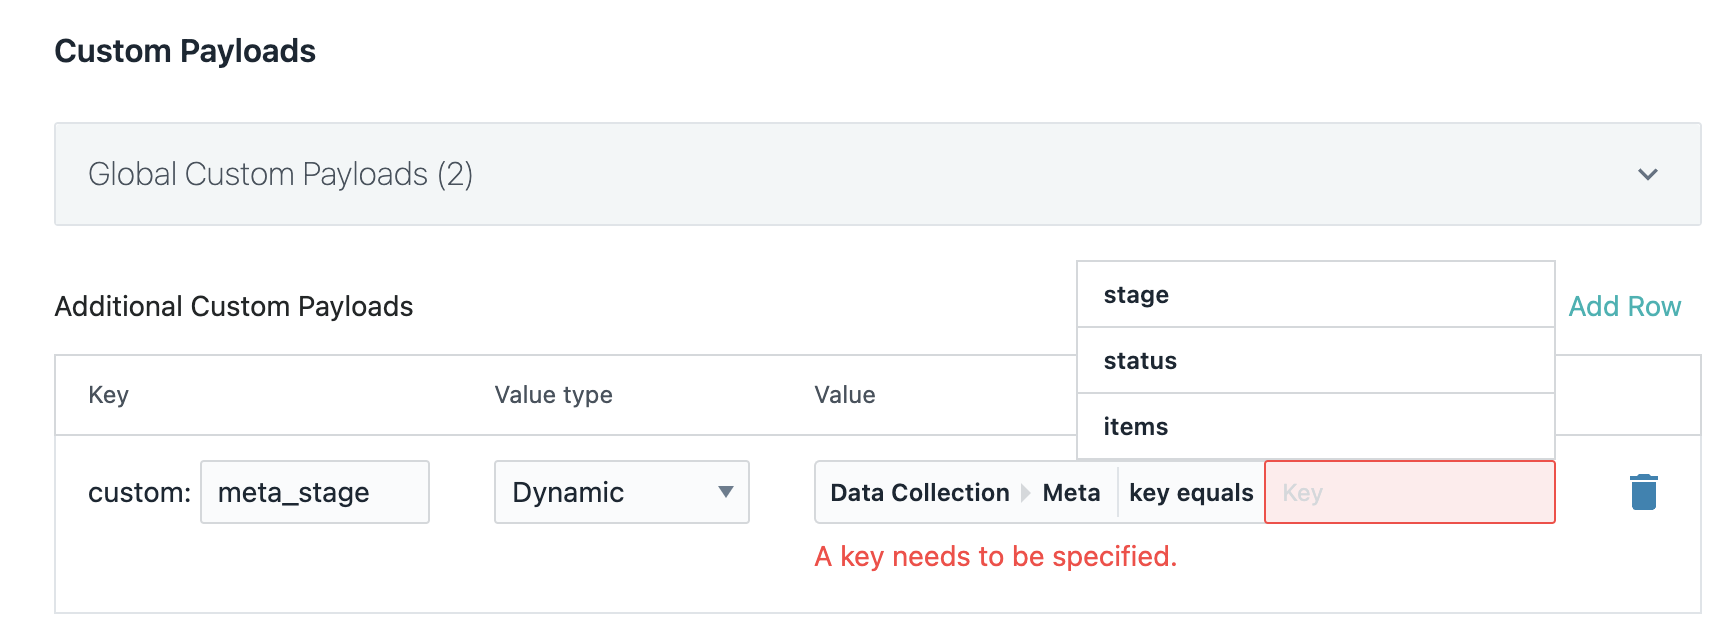
Dynamic custom payload fields in alert-specific configuration are also supported.
Select Dynamic Tag as shown in the following image:
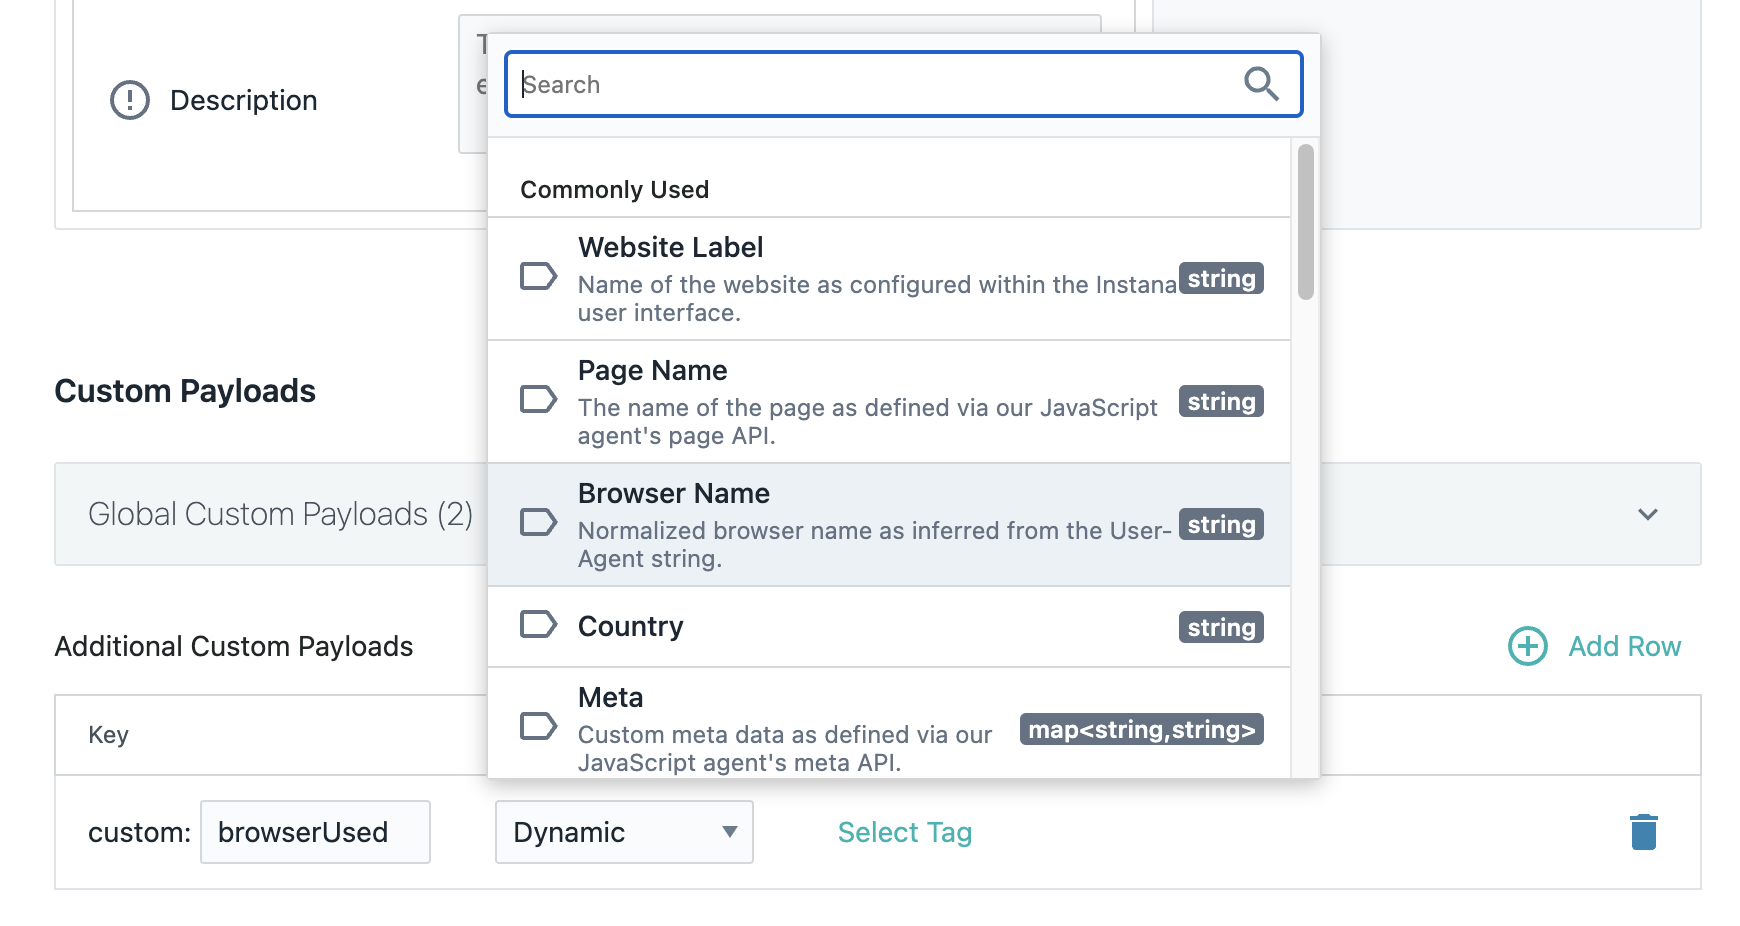
You can use the suggestions to select the correct key for the selected dynamic tag or add it manually as shown in the following image:
Terraform Support
Instana enables Infrastructure as Code (IaC) capabilities by providing a Terraform resource for managing Website Smart Alerts programmatically. This capability allows DevOps and SRE teams to define, deploy, and maintain alert configurations as code. It helps improve automation and consistency across environments.
For more information about managing Website Smart Alerts by using Terraform, see Instana website alert configuration.
Impacted users
The Impacted Users feature for website Smart Alerts helps identify widespread performance issues by tracking how many users experience a certain condition.
For each issue created by a website Smart Alert, you can now see the following details:
-
Total impacted users: The total number of users impacted while using the website where the Smart Alert is created. This count is measured from the time the alert is triggered until either the current time or the issue closing time, whichever occurs first. An Impacted User refers to any user whose browser emits a beacon that violates the alert criteria. For example, if a Smart Alert is configured for page load durations greater than 500 ms, an impacted user is any individual who experiences a page load with a duration greater than the 500 ms threshold. The user in this case is the user that is identified in the website agent. If no user is logged in, the session ID is used to identify the impacted user. For more information, see Identifying users.
-
Total users: The total number of users that were using the website. This tracking starts from the time that the alert is triggered until either the current time or the issue closing time, whichever occurs first.
-
Impact report: A detailed report shows the specific user IDs impacted for the website. This report shows a more detailed breakdown of the impacted users where each record in the table, represents a unique user for the website. For each user, the report includes their name, email address, country, subdivision, Config Label (website or mobile application name where the user was impacted), and source (web or mobile application) if reported by the agent.

Impacted user information is available only for the past 7 days. For more information, see [IBM data retention policy](../policies/index.html#data-retention-policy).
{: note}