Making your diagrams more effective
You can use color and layout options to create diagrams that are both informative and visually appealing. You can also change the numbers (the order) of the activities and add text annotations to make your diagrams clear and precise.
Adding color to your process diagrams
You can add color to your process diagram to visually classify activities in your process, for example, highlighting areas of focus for improvement. You might also want to add color to gateways to call attention to key decision points, or add color to events to indicate their importance or show their outcomes (success or failure).
You can add a color legend (one created by your organization, or one that you add yourself) to convey the significance of each color.
- To use a predefined color legend, click Show color legend on the canvas toolbar (Color legends in the new UI). Click Select color legend to choose a predefined color legend if one exists.
- To add your own color legend for this diagram, click Show Color Legend and add a label for each color to indicate its significance. In the new UI, click Add color legend in the canvas footer and add values to colors.
- To add color, right-click the activity, event, or gateway and select one of the colors from the
palette. If you are using a color legend, hovering over a color shows you its name in the legend.
To select multiple elements, use Ctrl+click or Cmd+click to select the elements you want. Or, in the classic UI, select the first element and then use Shift+click to select the last element and all other elements in the shortest path. Alternatively, you can toggle the Marquee Select button
 and draw a rectangle around the elements you want to color.
Improving process layout
As you add elements to your process diagram, Blueworks Live automatically lays out the elements according to a default layout algorithm. You can change this layout in several ways to customize your diagram.
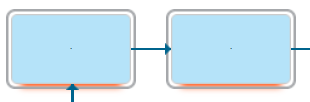
- By default, new elements are inserted to the right of the previous element in the same swimlane. You can drag an activity below or above the previous activity to lay out sequential activities vertically by dragging the activity to the desired position until the gray positioning bar appears and dropping the element in its new location. You cannot place an activity in a location that is further left than a preceding activity or further right than a following activity.
- When you are authoring gateways with multiple outgoing paths, the default layout of the paths might become cluttered and difficult to read as you add more flows. To realign the outgoing parallel paths, right-click the gateway and select Align Parallel Flows.
- You can move the labels relative to the lines on your diagram to make them easier to read. Click
and drag the label, and a green box appears. Drag it and drop it in another position in the same swimlane.
- For vertical lines, move the label along the line, or to the right, left, or center of the line.
- For horizontal lines, move the label along the line, or to above or below the line.
- You can choose to dock a connection at different points on a diagram element, such as an
activity, gateway, endpoint, or collapsed subprocess. Click a line that connects two elements and
you see small icons
 on each end. If you drag one of these docking point icons, you see the available docking points for the line.
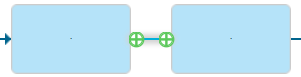
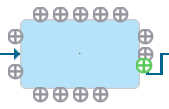
- You can maintain elements in the same position by pinning them. Right-click an element and
select Pin Activity, or select and right-click a group of elements and select
Pin. Pinned elements in a diagram are shown with a surrounding aura. These elements retain their pinned position whenever possible, even if you modify the diagram, until you select Unpin. However, certain modifications to the diagram, including creating a subprocess that contains pinned elements, causes them to unpin and revert to their default layout positions.
- You can undo any layout customizations that you made and revert to the default layout by right-clicking the background of your diagram and selecting Reset Layout. Pinned elements do not move.
Changing activity numbering
To see the numbers of the activities in your diagram, right-click and select Show Activity Numbering. In the new UI, click the Numbering button on the header. These numbers are displayed on the diagram, used in the Documentation view, and exported to PDF, Microsoft Word, Microsoft PowerPoint, and Microsoft Excel when you export your diagram.
As you model your process, including adding activities, removing activities, and moving activities around, the default sequence of activity numbers that are generated by Blueworks Live might no longer be the sequence you want. You can choose to display either default or custom numbers on your diagram.
- Click Numbering in the diagram toolbar. A new dialog window opens. In the new UI, right-click the diagram and select Custom numbering.
- If you want normal start and end events to be included in the numbering, click Include normal start and end events. Otherwise, these events are not numbered.
- Boundary events (intermediate events that are attached to the boundary of an activity) are always numbered. The numbers can make the diagram look cluttered if an activity has more than one boundary event. If you want to hide the numbers, clear Show numbering on boundary events in the diagram. The numbers are still shown in the Documentation view.
- Select Use custom numbers and update the numbers that you want to change. You can click the column headings to sort the numbers by activity, default numbers, or custom numbers. Duplicate numbers are shown in red.
- When you finish updating the numbers, click Apply Changes. The changes that you made are reflected on the diagram that you see in the background.
If another user adds or removes activities, events, or gateways from the process at the same time as you are changing numbers, you see a warning. You are no longer looking at the most recent copy of the list of activities and might want to talk to the other user before you continue. If you click Apply Changes, elements that the other user deleted are ignored. All other changes are applied.
If another user is updating the numbers for the process at the same time as you are, you see an error in the window. If you click Apply Changes, your changes might overwrite theirs. You might want to talk to the other user before you continue.
If you want to remove the numbering, right-click the diagram again and select Hide Activity Numbering.
Adding text annotations
You can add descriptive text directly on your process diagram to convey additional information and to make the diagram more understandable for your audience.
To add text, right-click the diagram background or an activity and select Add text annotation. After you add a text annotation, you can drag it to a different location. Other activities and lines flow around the text annotation, so you can even put text between activities. You can make the text box larger or smaller by dragging one of the corners. Click the text annotation to edit it, or delete the annotation by right-clicking it and selecting Delete.
You can also change the docking point location if you attach a text annotation to an activity.
Click the line that connects the annotation to the activity and you see a small docking point icon.
Drag the icon to see the available docking points on the activity and choose the one you
want.
Text annotations are shown in the Documentation view and exported when you export the diagram.
Next step
After you finish refining you diagram, you can go on to the next step and analyze your process. For more information, see Analyzing a process.