Troubleshooting
Problem
Diagnosing The Problem
- Performance problems with web services message traffic.
- Intermittent performance problems with web services message traffic.
- Exception Isolation. For example, is the problem happening in the web services engine code, some other WebSphere component, or the application code?
- Analyzing slow web services application startup, slow JAXBContext, WSDL build errors, or other server-start or application-start problems. These web services problems are better diagnosed with the full engine trace.
- The trace specification produces minimal output. WSPerf trace is lightweight, when compared to the full web services engine trace, see MustGather: Web Services engine and tooling problems for WebSphere Application Server
- Can enable and disable dynamically at runtime, no restart is required.
- With just a few key trace lines generated by the lightweight WSPerf trace, speed (performance) analysis, as well as exception-isolation analysis can both be done.
| Lines Of Trace | ||
|---|---|---|
| WSPerf Trace | Full Web Services Engine Trace | |
| JAX-WS proxy client test once, send request, receive response | 10 | aprox. 1,100 |
| JAX-WS service provider test once, receive one request, send response | 4 | aprox. 830 |
- The reason we can analyze and make solid conclusions about web services performance is because WebSphere web services engine has trace messages at boundaries of its engine code. Boundaries in this sense, are entry and exit points in web service engine code.
- All you need is the trace.
- Client - Time spent web services code.
- Client - Time spent waiting for the response from the web services provider.
- Service Provider - Time spent in IBM WebSphere web services engine code.
- Service Provider - Time spent in non web services engine code. This is the application code, the business logic.
- Whatever the web services provider application is doing, outside of the web services engine, can be measured.
- WSPerf trace specification:
*=info:com.ibm.ws.webservices.trace.WSPerf=all
- This can be enabled at runtime or set in the server configuration at startup. There is no particular advantage; either way will be sufficient to analyze the message traffic.
- Reference the Setting up a trace in WebSphere Application Server article to see how to enable a WebSphere diagnostic trace.
- It is recommended to include the *=info with WSPerf trace. Application debug statements, System.out.print(), etc., write to SystemOut.log. With the addition of *=info, application debug output will be interleaved with the WSPerf trace. The interleaved output, WSPerf with application debug, is highly desirable for performance, and exception-isolation analysis.
What is the pattern? What do we see in the trace? For a JAX-WS web service provider (JAX-RPC, service provider example is shown below), the pattern is: inbound-request, outbound-response.
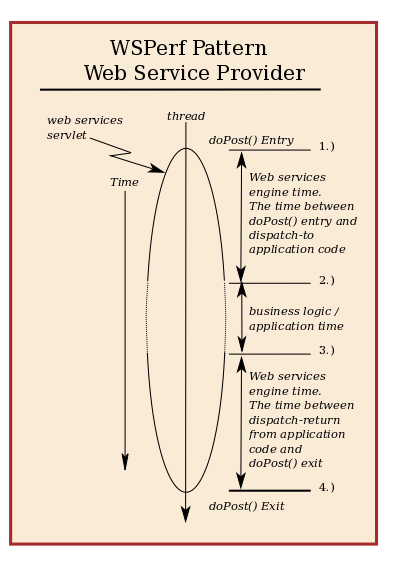
- doPost() Entry. The Web Services engine writes to trace when the engine is first for an inbound request.
- Dispatcher Calling. The Web Services engine writes to trace just before calling, dispatching to, the application code. This is the boundary between [web services] engine code and application code. This is the start of the business logic.
- Dispatch Returned. The Web Services engine writes to trace just after returning from application code. Boundary between engine code and the application code. This is the completion of the business logic.
- doPost() Exit. The Web Services engine writes to trace when the web services engine is complete with the inbound request.
- [MM/DD/YY 9:48:14:698 EDT] 000000a0 WSPerf 3 WASAxis2Servlet.doPost() entry
- [MM/DD/YY 9:48:14:701 EDT] 000000a0 WSPerf 1 org.apache.axis2.jaxws.server.dispatcher.JavaDispatcher invokeTargetOperation JavaDispatcher.invokeTargetOperation() calling
... Time Gap ... 3001 milliseconds.
- [MM/DD/YY 9:48:17:702 EDT] 000000a0 WSPerf 1 org.apache.axis2.jaxws.server.dispatcher.JavaDispatcher invokeTargetOperation JavaDispatcher.invokeTargetOperation() returned.
- [MM/DD/YY 9:48:17:704 EDT] 000000a0 WSPerf 3 WASAxis2Servlet.doPost() exit
- The boundaries for the WSPerf web service provider pattern are contained within the web services servlet (web services engine code). The analysis, conclusions, etc., made based on WSPerf service provider trace, will be confined to this boundary. For example, WebSphere web container, and web server are outside the scope of the web service provider engine trace. The time spent in web container before the web services engine (servlet) gets called, is not contained between lines (1) and (4).
For the web service provider case, the application's business logic is contained within the WSPerf boundaries. Thus, the total time the business logic takes can be measured.
The business logic is whatever the application does on its own, call a session bean, update database, make a call to a web service, etc. - What is the total time it takes for a service provider application to receive a request and send a response? The total time it takes to receive a request and send a response is the time difference between doPost entry and doPost exit. These are WSPerf lines (1) WASAxis2Servlet.doPost() entry and (4) WASAxis2Servlet.doPost() exit
In our sample we have the following:
9:48:17:704 EDT - 9:48:14:698 EDT = 3006 milliseconds - How much time was spent in the application's business logic? This is the time between WSPerf lines (2) invokeTargetOperation JavaDispatcher.invokeTargetOperation() calling and (3) invokeTargetOperation JavaDispatcher.invokeTargetOperation() returned
In our sample we have the following: 9:48:17:702 - 9:48:14:701 = 3,001 milliseconds - How much time was spent in WebSphere web services code? The amount of time WebSphere spends web services code is the time between doPost entry and dispatch-to application code Plus the time between dispatch-return, and doPost exit. This is the time between (1) and (2), plus the time between (3) and (4)
In our sample we have the following:
(9:48:14:701 EDT - 9:48:14:698 EDT) + (9:48:17:704 EDT - 10/7/14 9:48:17:702 EDT)
(3) + (2) = 5 milliseconds
What is the pattern? What do we see in the trace? For each client request, the pattern is:
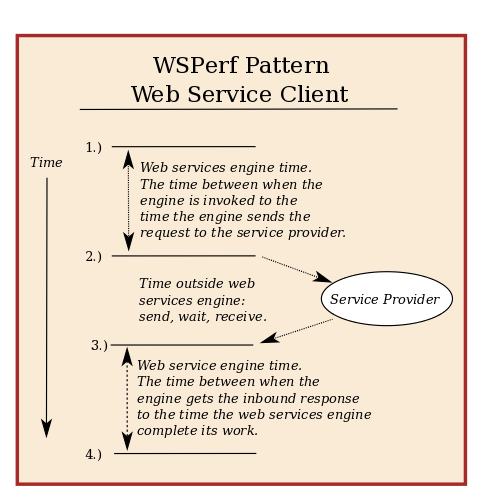
- Time spent in web services engine. This is the time from when the engine gets invoked, to the time the engine sends the request (pass control to WebSphere channel framework). The engine writes a WSPerf line just before the outbound request.
- Time spent waiting for the service provider to respond. This includes time inside WebSphere http and tcp channel code, to send and receive over the http connection. This is time spent outside of web service engine code.
- Time spent in web services engine . This is the time from when the engine gets the inbound response, to when the [web services] engine writes its last WSPerf line.
- [MM/DD/YY 7:50:54:583 EDT] 0000007f WSPerf 1 org.apache.axis2.jaxws.client.proxy.JAXWSProxyHandler invoke JAXWSProxyHandler.invoke() calling method getBinding
[MM/DD/YY 7:50:54:583 EDT] 0000007f WSPerf 1 org.apache.axis2.jaxws.client.proxy.JAXWSProxyHandler invoke JAXWSProxyHandler method.invoke() calling method getBinding
[MM/DD/YY 7:50:54:584 EDT] 0000007f WSPerf 1 org.apache.axis2.jaxws.client.proxy.JAXWSProxyHandler invoke JAXWSProxyHandler method.invoke() returned method getBinding
[MM/DD/YY 7:50:54:584 EDT] 0000007f SystemOut O Service call. getPerson method call
[MM/DD/YY 7:50:54:584 EDT] 0000007f WSPerf 1 org.apache.axis2.jaxws.client.proxy.JAXWSProxyHandler invoke JAXWSProxyHandler.invoke() calling method getPerson
[MM/DD/YY 7:50:54:584 EDT] 0000007f WSPerf 1 org.apache.axis2.jaxws.client.proxy.JAXWSProxyHandler invoke JAXWSProxyHandler.invokeSEIMethod()calling method getPerson
[MM/DD/YY 7:50:54:584 EDT] 0000007f WSPerf 3 HttpOutSyncWriter.writeHeaders.sendRequestHeaders() calling http://{host}:{port}/SlowService/SlowService
[MM/DD/YY 7:50:54:584 EDT] 0000007f WSPerf 3 HttpOutSyncWriter.writeHeaders.sendRequestHeaders() returned - [MM/DD/YY 7:50:54:584 EDT] 0000007f WSPerf 3 HttpOutSyncWriter.finishBufferRequest.finishRequestMessage() calling http://{host}:{port}/SlowService/SlowService
... Time Gap... 2002 milliseconds. Time spent waiting for the service provider to respond.
- [MM/DD/YY 7:50:56:586 EDT] 0000007f WSPerf 3 HttpOutSyncWriter.finishBufferRequest.finishRequestMessage() returned
- [MM/DD/YY 7:50:56:586 EDT] 0000007f WSPerf 1 org.apache.axis2.jaxws.client.proxy.JAXWSProxyHandler invoke JAXWSProxyHandler.invokeSEIMethod() returned method getPerson
- [MM/DD/YY 7:50:56:586 EDT] 0000007f SystemOut O Service call. getPerson method return
Here we have 7:50:56:586 - 7:50:54:583 = 2,003 milliseconds.
What is the time spent waiting for a response from the service provider?
HttpOutSyncWriter.finishBufferRequest.finishRequestMessage() calling
HttpOutSyncWriter.finishBufferRequest.finishRequestMessage() returned
In the example above, the time the web service client spends waiting for a response from the services provider is
7:50:56:586 - 7:50:54:584 = 2,002 milliseconds.
The time it takes to process the inbound response is the time between lines (3) and (4). The time from when the response has returned, to the time the engine is complete with the client call. Between these two lines, HttpOutSyncWriter.finishBufferRequest.finishRequestMessage() returned, and JAXWSProxyHandler.invokeSEIMethod() returned method <methodName>
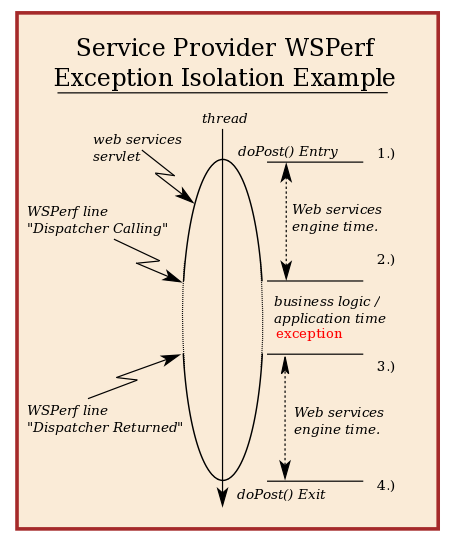
WSPerf trace can help us isolate exceptions seen in web services applications. Understanding WSPerf trace patterns can help us determine, from where are problems coming: WebSphere web service engine? Web services application code? Some other WebSphere component? In this way, we can isolate exceptions, to a more specific area, and therefore quickly simplify the troubleshooting equation.
WSPerf trace can be used to determine what code is running at the time an exception occurs. Although WSPerf trace is well suited for performance analysis, WSPerf trace can also help us isolate exceptions. Once the exception is isolated, within or outside of WebSphere web services engine, we know which troubleshooting path to follow.
Let us take a web services provider application as an example. There is an exception seen in the WebSphere logs coming from the web services application. A WebSphere web services trace is turned on to gather diagnostic data. Trace analysis shows an Exception happens between WSPerf Provider lines labeled (2) and (3). Between these WSPerf lines, we know application code is executing, not web services engine code.
In this particular case, with the exception happening while business logic/application code is executing, it almost 100% concluded there is a problem in the application business logic, or a problem in any WebSphere component used by the application. There is a possibility the WebSphere web services engine could have an adverse effect on the business logic. For example, the WebSphere web services engine unmarshals a jaxb object incorrectly. No error seen in the web services engine, just missing or incorrect data in a jaxb object. If the application is expecting something from the inbound xml-soap message, but the web services engine does not unmarshal as expected, then even though an exception happens after invokeTargetOperation() calling , and before invokeTargetOperation() returned, the root cause could still be in web services engine.
- The exception happened when the service-provider's application business logic was executing.
- Based on that knowledge, root cause determination should focus on service-provider application debug, or WebSphere component used by the application.
- The WebSphere web services engine is most likely not the root cause.
- Do we have a Provider or Client application? This information is helpful to identify the pattern.
- Find the Exception.
- Go up in the trace, find the next WSPerf trace line.
- Match that WSPerf line with a line from a known WSPerf pattern.
- Now you know where the exception falls with respect to the web services engine.
[MM/DD/YY9:24:54:895 EST] 00000069 WSPerf 1 org.apache.axis2.jaxws.client.proxy.JAXWSProxyHandler invoke JAXWSProxyHandler method.invoke() calling method getBinding
[MM/DD/YY9:24:54:895 EST] 00000069 WSPerf 1 org.apache.axis2.jaxws.client.proxy.JAXWSProxyHandler invoke JAXWSProxyHandler method.invoke() returned method getBinding.
[MM/DD/YY9:24:54:896 EST] 00000069 WSPerf 1 org.apache.axis2.jaxws.client.proxy.JAXWSProxyHandler invoke JAXWSProxyHandler.invoke() calling method {methodName}
[MM/DD/YY9:24:54:896 EST] 00000069 WSPerf 1 org.apache.axis2.jaxws.client.proxy.JAXWSProxyHandler invoke JAXWSProxyHandler.invokeSEIMethod() calling method {methodName}
[MM/DD/YY9:25:21:798 EST] 00000067 FfdcProvider W com.ibm.ws.ffdc.impl.FfdcProvider logIncident FFDC1003I: FFDC Incident emitted on...
[MM/DD/YY9:25:21:995 EST] 00000067 ServletWrappe E com.ibm.ws.webcontainer.servlet.ServletWrapper service SRVE0068E: An exception was thrown by one of the service methods of the servlet {servletName} in application {applicationName}.
Exception created:
[javax.xml.ws.soap. SOAPFaultException: java.net. ConnectException: Connection timed out
at org.apache.axis2.jaxws.marshaller.impl.alt.MethodMarshallerUtils.createSystemException(MethodMarshallerUtils.java:1353)
at org.apache.axis2.jaxws.marshaller.impl.alt.MethodMarshallerUtils.demarshalFaultResponse(MethodMarshallerUtils.java:1079)
at org.apache.axis2.jaxws.marshaller.impl.alt.DocLitWrappedMethodMarshaller.demarshalFaultResponse(DocLitWrappedMethodMarshaller.java:680)
at ...
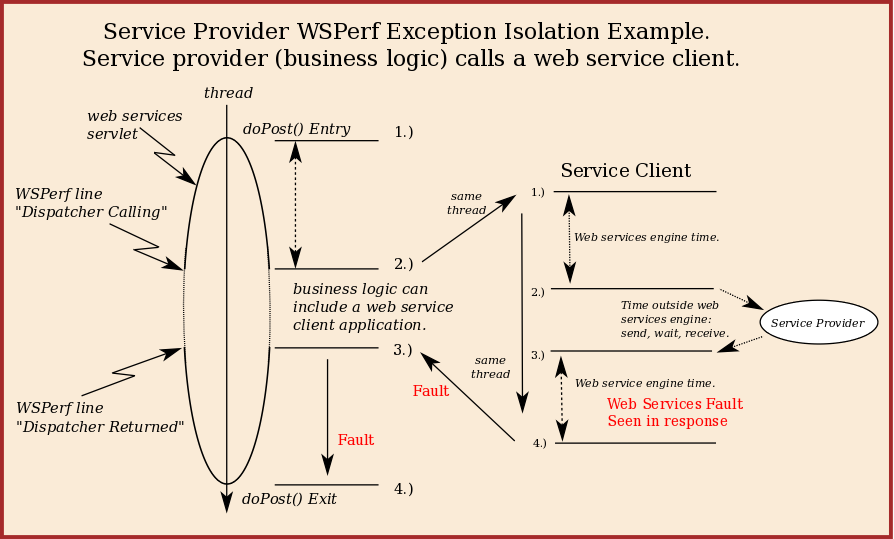
The analysis can quickly become more complex when the service provider contains a call, or even multiple calls to web services clients. This is an example where a service client and a service provider are writing to the same trace file. The web services client activity shown here, is just something the service-provider application is doing between WSPerf provider (left side of the diagram) lines, (2) and (3).
In this example, the following will be true:
- The service client and service provider applications will log to the same WebSphere thread (Assumes no asynchronous work, e.g., WorkManager, async beans).
- WSPerf client and WSPerf provider speed can be measured independently because the WSPerf client and provider patterns are distinct.
For message traffic analysis, the best way to analyze all of your WSPerf trace files is use IBM Trace and Request Analyzer for WebSphere Application Server (TRA). TRA is a freely available tool that automates the trace analysis task. To demonstrate how powerful the WSPerf trace points really are, open a WSPerf trace file with TRA.
What follows is specific to our WSPerf topic. Note however, TRA is very generic; it can handle any trace pattern you define. If you can define a pattern in a trace, then you can use TRA to help with the analysis. The pattern could be anything, a WebSphere component (EJB, J2C, Transactions, web container, etc.), or the pattern could be defined by your application code's debug/print statements.
TRA is an excellent time-saving tool. TRA can automatically analyze each thread in your WebSphere trace files. All you need is WebSpghere trace files and knowledge of your trace pattern. Follow the instructions to create and analyze with a WSPerf custom pattern:
- Start TRA
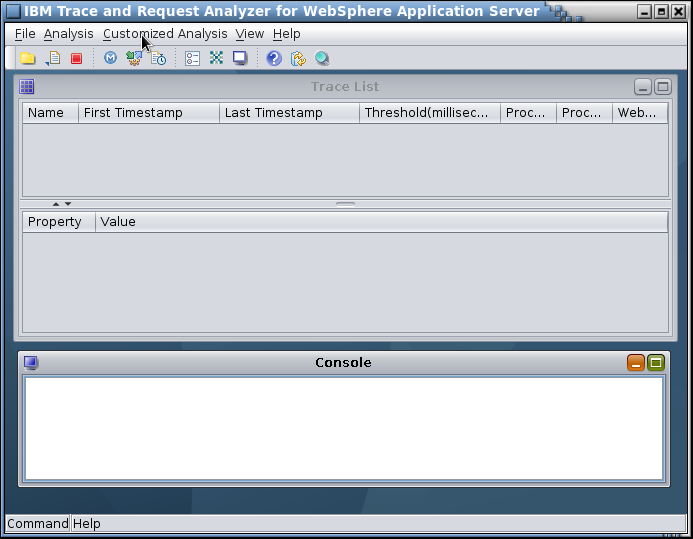
- In TRA Main Menu. Go to, View -> Pattern Manager
Your TRA patterns configuration will be under " Trace Pattern from local repository"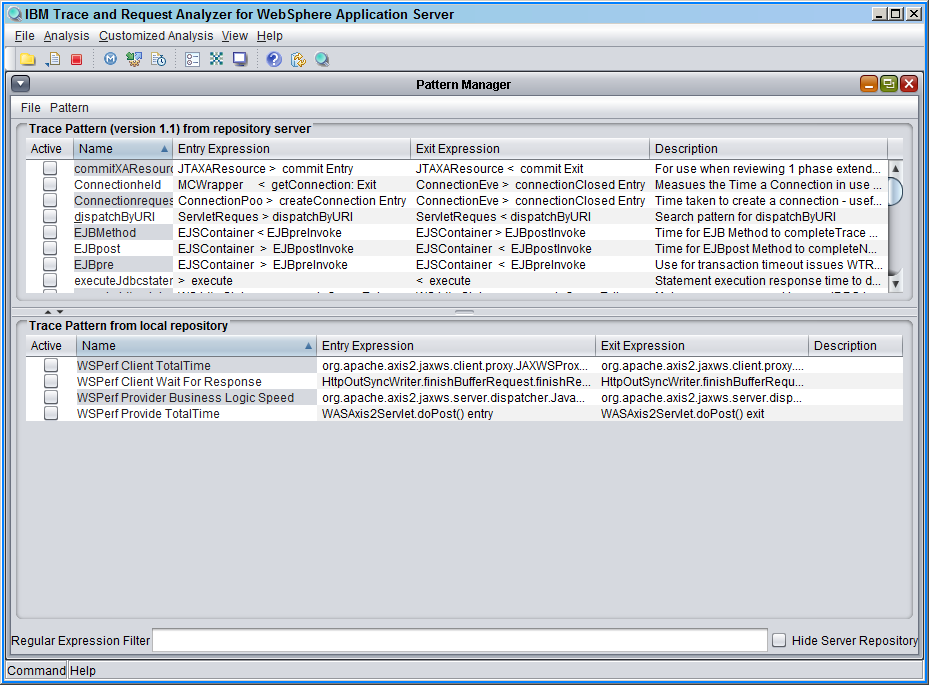
- In the Pattern Manager Window. Pattern -> New
This should open "New Trace Pattern" dialog box.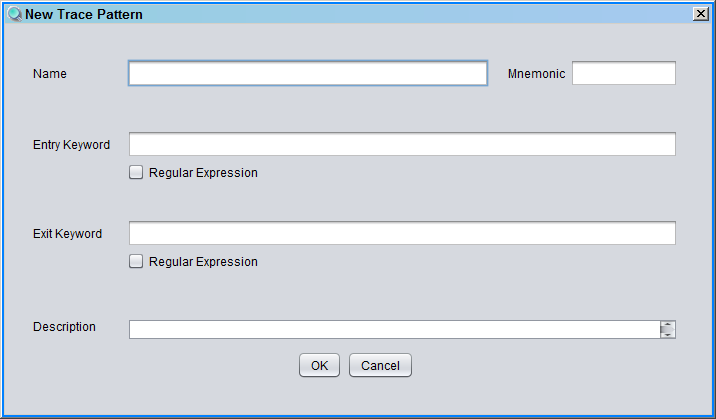
- Create a pattern to measure how much time was spent in a web service provider application's business logic:
Name: Give this any name you like. For example "WSPerf-Service-Provider-BusLogic"
Mnemonic: Leave empty (optional)
Entry Keyword: invokeTargetOperation JavaDispatcher.invokeTargetOperation() calling
Exit Keyword: invokeTargetOperation JavaDispatcher.invokeTargetOperation() returned
Description: Leave empty (optional)
Press Ok - You now have created a TRA custom pattern on your local repository (local TRA configuration). Once created, you can now use this pattern to analyze WebSphere web services trace(s). The key parts are the entry and exit keywords. If you want to analyze the time it takes for the application business logic, use the custom "WSPerf-Service-Provider-BusLogic" pattern.
- TRA main Menu. File -> Open WebSphere Trace.
- Choose the trace file or files. Should result in open "Analysis Pattern" dialog
- STOP. This dialog will need some attention. The TRA "Analysis Pattern" dialog is important.
- There are two areas, "Trace Pattern from repository server", and "Trace pattern from local repository."
- Select the check box next to your new pattern, "WSPerf-Service-Provider-BusLogic"
- You can choose as many patterns as you like.
- Choose the threshold:
The threshold tells TRA how small a time gap to ignore. For example, 1000 means TRA will ignore any time gaps less than 1000 milliseconds.
If your trace shows a performance problem on the order of 5-10 seconds, 1000 threshold is probably small enough. On the other hand, if your trace represents a performance problem of 100-300 milliseconds with expected speed of less than 50 milliseconds, then a threshold of 1000 milliseconds is too large. The general rule is, set the threshold to roughly the order of magnitude of your performance problem, in the second case say 40 milliseconds. - After choosing a threshold, click the Analyze button and wait.
- The result of the Analyze button is a Trace List dialog. This box lists each trace or set of traces you have analyzed.
- Highlight the trace, or set of trace files.
- TRA Main Menu -> Customized Analysis. Each custom analysis you chose your check boxes for the patterns will be listed under the "Customized Analysis menu.
- Choose our new pattern, "WSPerf-Service-Provider-BusLogic"
- The result is TRA dialog box, "Custom Analysis of WSPerf-Service-Provider-BusLogic"
- In a client WSPerf trace, you will see, what may appear to be random, channel framework informational messages. The message is [mm/dd/yyyy hh:mm:ss EDT] WSChannelFram... CHFW0019I: The Transport Channel Service has started chain ... HttpOutboundChain:{host}:{port}.
- You will see CHFW0019I messages in a WSPerf trace when a new connection is opened. The CHFW0019I will not get written to the WSPerf trace when a pooled connection is used.
- WebSphere web services clients maintain an outbound connection pool. If the pool has an open connection, this "pooled" connection is given to the web services client. In this case, a new connection does not have to be established and there will be no CHFW0019I message.
- Documentation Reference for the web services client connection pool, IBM Knowledge Center, HTTP transport custom properties for web services applications
- When WebSphere first starts, you will get some one-time WSPerf trace output lines. For a message traffic performance analysis, it is safe to ignore these one-timer WSPerf trace lines. I found some WSPerf lines only occur at server startup and will not contribute to the runtime performance analysis of message traffic.
[date / time] threadxxx WSPerf 3 com.ibm.ws.webservices.trace.WSPerfClasses[null]
[date / time] threadxxx WSPerf WSPerf 1 org.apache.commons.logging.LogFactory getLog Using Log org.apache.commons.logging.impl.Jdk14Logger@a1b01ccb due to runtime packaging ... Class ... does not implement Log
[date / time] threadxxx WSPerf 3 getDoWSPerf exit: doWSPerf: true className: com.ibm.ws.webservices.engine.dispatchers.java.JavaDispatcher
The WSPerf trace is a feature of IBM WebSphere Application Server. WSPerf is well suited to find root causes of performance problems seen in WebSphere web services message traffic. The WSPerf trace feature was included into the WebSphere web services engine at its code boundaries. This aspect of WSPerf trace makes it an excellent tool for exception isolation analysis.
- (service provider) WASAxis2Servlet.doPost() entry
- (service provider) invokeTargetOperation JavaDispatcher.invokeTargetOperation() calling
- (service provider) invokeTargetOperation JavaDispatcher.invokeTargetOperation() returned
- (service provider) WASAxis2Servlet.doPost() exit
- (service client) org.apache.axis2.jaxws.client.proxy.JAXWSProxyHandler invoke JAXWSProxyHandler.invoke() calling method
- (service client) HttpOutSyncWriter.finishBufferRequest.finishRequestMessage() calling
- (service client) HttpOutSyncWriter.finishBufferRequest.finishRequestMessage() returned
- (service client) org.apache.axis2.jaxws.client.proxy.JAXWSProxyHandler invoke JAXWSProxyHandler.invokeSEIMethod() returned method
JAX-WS Dispatch Client Trace Example
- Provider and client running in same JVM
- The service provider application is running in thread 000000a2
- Along the 000000a2 thread, we can see four WSPerf trace lines. These represent the WSPerf pattern for a service provider. See WSPerf Pattern Web Service Provider diagram above
- The service client application is running in thread 0000009a
- The important client-side trace lines are 2.) and 3.). The time between these WSPerf lines is the time outside web services engine: send, wait for response from service provider, receive. See WSPerf Pattern Web Service Client diagram above
[MM/DD/YY HH:MM:SS:mmm] 0000009a WSPerf 3 HttpOutSyncWriter.writeHeaders.sendRequestHeaders() calling http://{host}:{port}/SlowService/SlowService
[MM/DD/YY HH:MM:SS:mmm] 0000009a WSPerf 3 HttpOutSyncWriter.writeHeaders.sendRequestHeaders() returned
[MM/DD/YY HH:MM:SS:mmm] 0000009a WSPerf 3 HttpOutSyncWriter.finishBufferRequest.finishRequestMessage() calling http://{host}:{port}/SlowService/SlowService
[MM/DD/YY HH:MM:SS:mmm] 000000a2 WSPerf 3 WASAxis2Servlet.doPost() entry
[MM/DD/YY HH:MM:SS:mmm] 000000a2 WSPerf 1 org.apache.axis2.jaxws.server.dispatcher.JavaDispatcher invokeTargetOperation JavaDispatcher.invokeTargetOperation() calling
[MM/DD/YY HH:MM:SS:mmm] 000000a2 WSPerf 1 org.apache.axis2.jaxws.server.dispatcher.JavaDispatcher invokeTargetOperation JavaDispatcher.invokeTargetOperation() returned
[MM/DD/YY HH:MM:SS:mmm] 000000a2 WSPerf 3 WASAxis2Servlet.doPost() exit
[MM/DD/YY HH:MM:SS:mmm] 0000009a WSPerf 3 HttpOutSyncWriter.finishBufferRequest.finishRequestMessage() returned
- Provider and client running in same JVM
- Notice the two thread id's 000000a2 and 000000a5.
- 000000a2 is the thread on which the client (consumer) is running.
- 000000a5 is the thread on which the service provider is running.
[MM/DD/YY 8:44:29:023 EDT] 000000a2 WSPerf 1 org.apache.axis2.jaxws.client.proxy.JAXWSProxyHandler invoke JAXWSProxyHandler.invoke() calling method getBinding
[MM/DD/YY 8:44:29:023 EDT] 000000a2 WSPerf 1 org.apache.axis2.jaxws.client.proxy.JAXWSProxyHandler invoke JAXWSProxyHandler method.invoke() calling method getBinding
[MM/DD/YY 8:44:29:023 EDT] 000000a2 WSPerf1 org.apache.axis2.jaxws.client.proxy.JAXWSProxyHandler invoke JAXWSProxyHandler method.invoke() returned method getBinding
[MM/DD/YY 8:44:29:024 EDT] 000000a2 WSPerf 1 org.apache.axis2.jaxws.client.proxy.JAXWSProxyHandler invoke JAXWSProxyHandler.invoke() calling method getRequestContext
[MM/DD/YY 8:44:29:024 EDT] 000000a2 WSPerf 1 org.apache.axis2.jaxws.client.proxy.JAXWSProxyHandler invoke JAXWSProxyHandler method.invoke() calling method getRequestContext
[MM/DD/YY 8:44:29:024 EDT] 000000a2 WSPerf 1 org.apache.axis2.jaxws.client.proxy.JAXWSProxyHandler invoke JAXWSProxyHandler method.invoke() returned method getRequestContext
[MM/DD/YY 8:44:29:024 EDT] 000000a2 WSPerf 1 org.apache.axis2.jaxws.client.proxy.JAXWSProxyHandler invoke JAXWSProxyHandler.invoke() calling method echoOperation
[MM/DD/YY 8:44:29:024 EDT] 000000a2 WSPerf 1 org.apache.axis2.jaxws.client.proxy.JAXWSProxyHandler invoke JAXWSProxyHandler.invokeSEIMethod() calling method echoOperation ...
[MM/DD/YY 8:44:30:050 EDT] 000000a5 WSPerf 1 org.apache.axis2.jaxws.server.dispatcher.JavaDispatcher invokeTargetOperation JavaDispatcher.invokeTargetOperation() calling
[MM/DD/YY 8:44:30:050 EDT] 000000a5 SystemOut O >> JAX-WS EchoService: Request received.
[MM/DD/YY 8:44:30:050 EDT] 000000a5 SystemOut O >> JAX-WS EchoService input string: 'Hi'
[MM/DD/YY 8:44:30:050 EDT] 000000a5 WSPerf 1 org.apache.axis2.jaxws.server.dispatcher.JavaDispatcher invokeTargetOperation JavaDispatcher.invokeTargetOperation() returned ...
[MM/DD/YY 8:44:30:224 EDT] 000000a2 WSPerf 1 org.apache.axis2.jaxws.client.proxy.JAXWSProxyHandler invoke JAXWSProxyHandler.invokeSEIMethod() returned method echoOperation
[MM/DD/YY 8:44:30:225 EDT] 000000a2 SystemOut O Response from echo JAX-WS Echo Service says: Hi
The JAX-RPC services provider pattern has the same meaning, the same interpretation as the JAX-WS service provider does. The specifics of the WSPerf lines are a bit different between JAX-WS and JAX-RPC, however; the meaning is the same:
- We have four WSPerf lines.
- The outer boundary is the web service servlet where we see a doPost entry() and a doPost() exit.
- We have two lines which define the boundary between web services engine code and application / business logic.
- The speed of the application code can be measured the same way as in the JAX-WS case. How much time was spent in the application's business logic? This is the time between WSPerf lines 2.) and 3.).
- In the JAX-RPC case lines 1.) and 2.) are "Before invocation" and "After invocation"
1.) [MM/DD/YY 14:44:01:937 EDT] 000000ac WSPerf 3 WebServicesServlet.doPost() entry
2.) [MM/DD/YY 14:44:01:939 EDT] 000000ac WSPerf 3 Before invocation
... time gap... application code / business logic.
3.) [MM/DD/YY 14:44:04:939 EDT] 000000ac WSPerf 3 After invocation
4.) [MM/DD/YY 14:44:04:940 EDT] 000000ac WSPerf 3 WebServicesServlet.doPost() exit
[MM/DD/YY 7:22:04:717 EDT] 000000bd WSPerf 3 Connection.invoke(MC,Object[],Vector) entry
[MM/DD/YY 7:22:04:717 EDT] 000000bd WSPerf 3 Connection.invoke(MessageContext, Vector, Vector) entry
[MM/DD/YY 7:22:04:717 EDT] 000000bd WSPerf 3 Connection.invoke(MessageContext) entry
[MM/DD/YY 7:22:04:718 EDT] 000000bd WSPerf 3 HttpOutboundChannelConnection.connect.oConn.connect() calling
[MM/DD/YY 7:22:04:718 EDT] 000000bd WSPerf 3 HttpOutboundChannelConnection.connect.oConn.connect() returned
2.) [MM/DD/YY 7:22:04:719 EDT] 000000bd WSPerf 3 HttpOutboundChannelConnection.sendSOAPRequest.finishRequestMessage() calling http://{host}:{port}/SlowService/SlowService
[MM/DD/YY 7:22:04:723 EDT] 000000bd WSPerf 3 Connection.invoke(MessageContext) exit
[MM/DD/YY 7:22:04:723 EDT] 000000bd WSPerf 3 Connection.invoke(MessageContext, Vector, Vector) exit
[MM/DD/YY 7:22:04:723 EDT] 000000bd WSPerf 3 Connection.invoke(MC,Object[],Vector) exit
[MM/DD/YY 7:22:04:723 EDT] 000000bd SystemOut O Service call. getPerson method return
JAX-WS Proxy Client
SlowPersonSearchPortProxy slowService = new SlowPersonSearchPortProxy(); System.out.println("Service call. getPerson method call"); Person p = slowService.getPerson(delaySec); System.out.println("Service call. getPerson method return"); @WebService(serviceName = "SlowService") public class SlowPersonSearch { @WebMethod(exclude = false) public Person getPerson(@WebParam(name = "delayTime", targetNamespace = "") int delayTime) { System.out.println("TOP getPerson method"); /* ... Business Logic ... */ System.out.println("END getPerson method"); return getRandPerson(); } } URL url = null; /* Sample Request <soapenv:Envelope xmlns:soapenv="http://schemas.xmlsoap.org/soap/envelope/"> <soapenv:Body> <a:getPerson xmlns:a="http://wascet.ibm.com/"> <delayTime>0</delayTime> </a:getPerson> </soapenv:Body> </soapenv:Envelope> */ try { url = new URL("http://{host}:{port}/SlowService/SlowService/SlowService.wsdl"); QName serviceName = new QName("http://wascet.ibm.com/", "SlowService"); QName portName = new QName("http://wascet.ibm.com/", "SlowPersonSearchPort"); Service service = Service.create(url, serviceName); Dispatch<SOAPMessage> dispatch = service.createDispatch(portName, SOAPMessage.class, Service.Mode.MESSAGE); SOAPMessage soapRquest = MessageFactory.newInstance(). createMessage(null, new FileInputStream("slowrequest.xml")); SOAPMessage soapResponse = dispatch.invoke(soapRquest); return soapResponse; } catch (Exception) {...} javax.naming.InitialContext ctx = new InitialContext(); SlowServiceLocator locator = ( SlowServiceLocator) ctx.lookup("java:comp/env/service/SlowService"); System.out.println("Service call. getPerson method call"); Person p = (Person) locator.getSlowPersonSearchPort().getPerson(delaySec); System.out.println("Service call. getPerson method return"); Document Location
Worldwide
Was this topic helpful?
Document Information
Modified date:
26 November 2019
UID
ibm11115901