Start of change

Setting up IBM Spectrum Scale performance monitoring bridge for Grafana

Follow these steps to set up the IBM Spectrum Scale™ performance monitoring bridge for Grafana.

The IBM Spectrum Scale system must run version 4.2.2 or above. Run the mmlsconfig command to view the current configuration of a GPFS™ cluster.

All the graphical charts that are displayed in Grafana are developed based on the performance data collected by the IBM Spectrum Scale performance monitoring tool. The performance monitoring tool packages are included in the IBM Spectrum Scale self-extracting package and get installed automatically during the IBM Spectrum Scale installation with the spectrumscale installation toolkit. If you did not use the spectrumscale installation toolkit or disabled the performance monitoring installation during your system setup, install the performance monitoring tool manually. For more information on manually installing the performance monitoring tool, see Manually installing the Performance Monitoring tool in the IBM Spectrum Scale: Concepts, Planning, and Installation Guide.

  1. Verify that Python and CherryPy are installed on the IBM Spectrum Scale system.

    IBM Spectrum Scale Performance Monitoring Bridge is a stand-alone Python application and requires Python 2.7 or above to function properly. CherryPy is an object-oriented HTTP framework in Python, with flexible configurations.

    In order to work, the bridge needs constant access to a pmcollector. To prevent the additional network traffic, install and run the bridge code directly on a pmcollector node. In a multi-collector environment, there is no need to run the bridge on each pmcollector node separately, if they are configured in federated mode. The federation mode allows collectors to connect and collaborate with their peer collectors. If the peers are specified, any query for measurement data must be directed to any of the collectors listed in the peer definition. The chosen collector collects and assembles a response based on all relevant data from all the collectors. For more information on the performance monitoring tool, see Performance Monitoring tool overview in IBM Spectrum Scale: Administration Guide

    Note: Python 2.7 and CherryPy 3.6.0 are the tested versions. Therefore, it is recommended to use Python 2.7 and CherryPy 3.6.0 or later versions. CherryPy is not installed on any GPFS™ cluster node by default. The easiest way to set up CherryPy is described in the ReadMe file available with any CherryPy installation package.
  2. Set up IBM Spectrum Scale performance monitoring bridge:
    1. Issue the following command on the pmcollector node to download and unpack the zimonGrafanaInt.tar file. The zimonGrafanaInt.tar file can be downloaded from here.

      # tar xf zimonGrafanaIntf.tar

    2. Issue the following command to run the bridge application from the directory zimonGrafanaIntf start:

      # python zimonGrafanaIntf.py –s < pmcollector host>

    3. If the bridge did establish the connection to the specified pmcollector and the initialization of the metadata was performed successfully, the following message is displayed at the end of line:
      server starting.
      Otherwise, check the zserver.log stored in the zimonGrafanaIntf directory. Additionally, issue the following command to check that the pmcollector service is running properly:
      # systemctl status pmcollector
  3. Install Grafana version 2.6.1 or later.
    Note:

    It is recommended to deploy Grafana 3.0.4 or later version. Download the Grafana source package from Grafana and install according to given instructions. Before you start Grafana for the first time, check the configuration options in Grafana configuration for port settings. Start the Grafana server as described on the Grafana configuration pages.

    If you want to use an earlier version of Grafana (earlier than 3.0.4), the dashboard configuration described in the next step cannot be used.

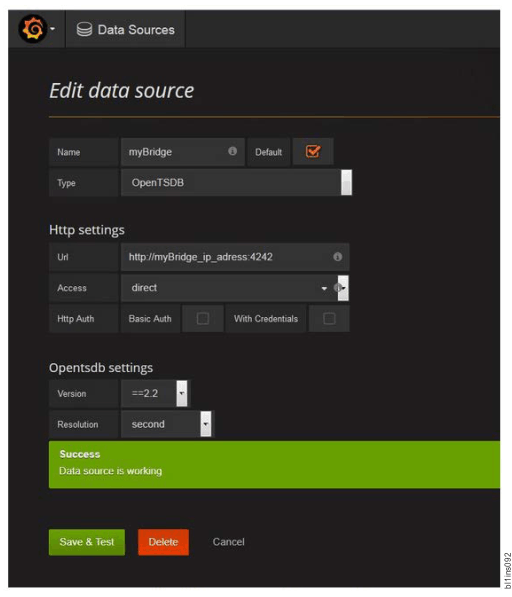
  4. Add the IBM Spectrum Scale bridge as a Data Source option to Grafana.
    Figure 1. Adding IBM Spectrum Scale monitoring bridge as a data source
    Adding IBM Spectrum Scale monitoring bridge as a data source
    1. Click the Grafana icon on the upper left corner to view the main menu.
    2. Select Data Sources to navigate to the data source list page.
    3. Click Add New in the navigation bar.
    4. Complete the configuration details for the OpenTSDB data source.
      Note:

      IBM Spectrum Scale bridge listens on port 4242, and the millisecond option is not supported for Resolution.

    5. Click Save & Test to ensure that the system is configured correctly.
End of change