Using IBM Spectrum Scale performance monitoring bridge with Grafana
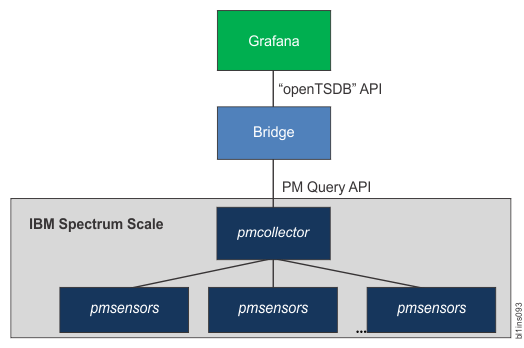
The IBM Spectrum Scale™ performance monitoring bridge is a stand-alone Python application, which uses Grafana to display performance data. Grafana is an open source tool for visualizing time series and application metrics. It provides a powerful platform to create, explore, and share dashboards and data. The IBM Spectrum Scale performance monitoring bridge emulates an openTSDB API, which is used by Grafana to set up and populate the graphs. The metadata received from IBM Spectrum Scale is used to create the Grafana graphs, and the data from IBM Spectrum Scale is used to populate these graphs.
Figure 1. IBM
Spectrum Scale integration framework for
Grafana 
IBM
Spectrum Scale performance monitoring bridge
could be used for exploring IBM
Spectrum Scale's
performance data on Grafana dashboards.
Attention: Grafana is a separate component and not a part of the IBM
Spectrum Scale4.2.2 package. Grafana can be downloaded from
IBM®
developerWorks® Wiki . For more information
on Grafana, see Grafana.
