AI insights and dashboards with IBM Turbonomic
Gain real-time insights into the health and performance of your applications 
Explore the interactive demo Book a live demo
AI insights and dashboards for IBM Turbonomic illustration
Less noise. Stronger insights.

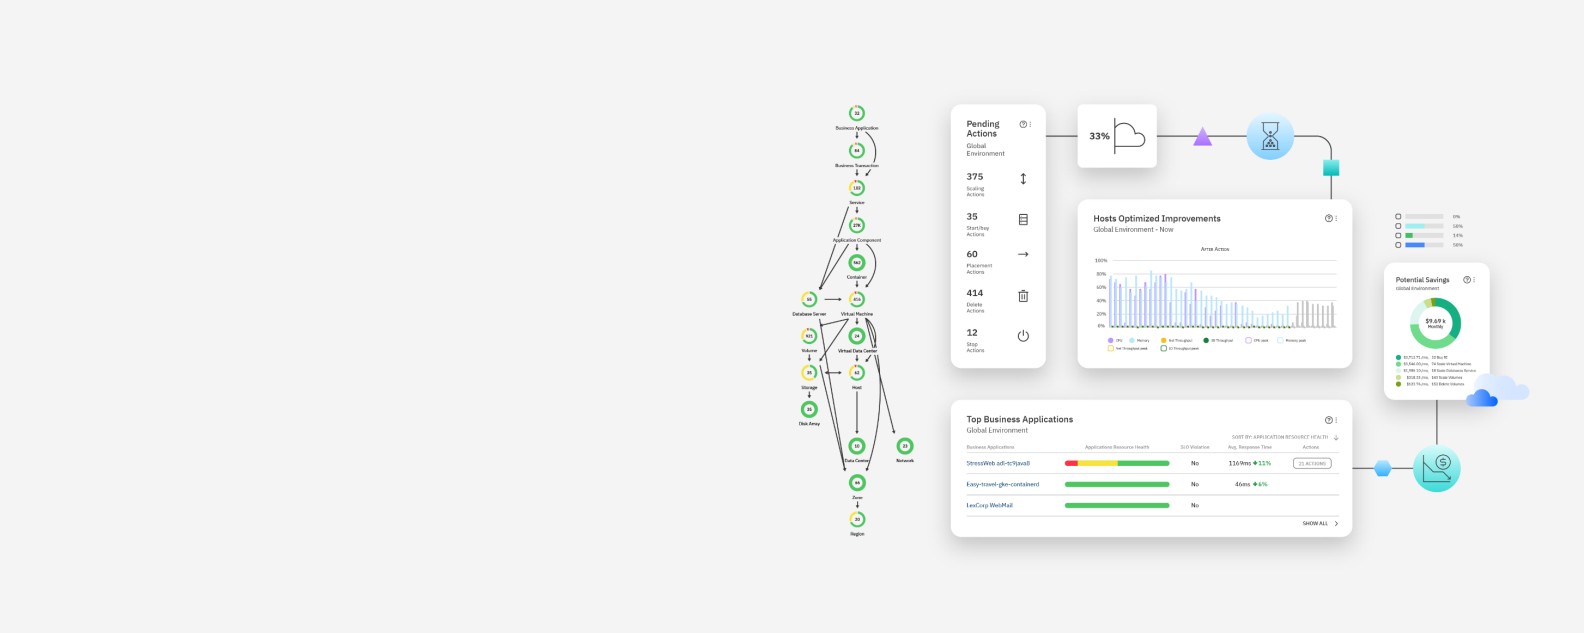
Modern AI and analytics tools generate and review so much data that it’s easy to overwhelm your teams with information. The IBM® Turbonomic® platform provides three built-in dashboards that show key metrics to help you make the best business decisions. The dashboards also show how automating those decisions will impact your environment. For other teams or views, you can easily create custom dashboards within the user interface.

See the dashboards
Benefits Streamlined insights for informed decisions

Turbonomic provides impactful AI-driven insights that empower teams to make informed decisions. By automating these insights, users enhance efficiency and ensure that actions align with their business goals.

Actionable dashboards for business excellence

Turbonomic comes equipped with three built-in dashboards that display crucial metrics, facilitating optimal decision-making and illustrating the impact of automating decisions. Users also have the flexibility to create custom dashboards tailored to different teams.

Comprehensive views for enhanced performance

Experience enhanced oversight with Turbonomic's executive dashboards, they offer real-time insights on workloads and cloud, on-prem, and container environments performance. Custom dashboards ensure accurate analytics and actions across the resource stack for all teams.

How AI insights work
Cloud executive dashboard View workloads, cloud service providers and your cloud accounts in real time. See how automation adoption impacts efficiency, performance and risks. Explore cumulative savings, necessary investments and potential savings, along with estimated cloud costs and usage of reserved instances.

On-prem executive dashboard View detailed workloads, actions history, cost savings and improvements. The current-state chart shows the top clusters by CPU, memory and storage capacity or utilization. For future planning, this dashboard also shows time-to-exhaustion of cluster resources. You can also see how the density of virtual machines per host or storage is improving.

Container platform dashboard View the overall performance, capacity and health of your container infrastructure. Get insights into top container platform clusters so you can assess their health and sort by risk level. View top services and top namespaces to identify quota and actual utilization.

Custom dashboard The IBM Turbonomic platform allows you to scope to views that matter to different teams. Regardless of how your organization is structured, every team can get the information they need, knowing that the analytics and actions are accounting for the resource relationships across the stack.
Reviews
It’s time you Turbo

Start your journey to continuous application performance while safely reducing cost.

Try Turbonomic for free Book a live demo
More ways to explore Documentation Education Community Pricing Resources