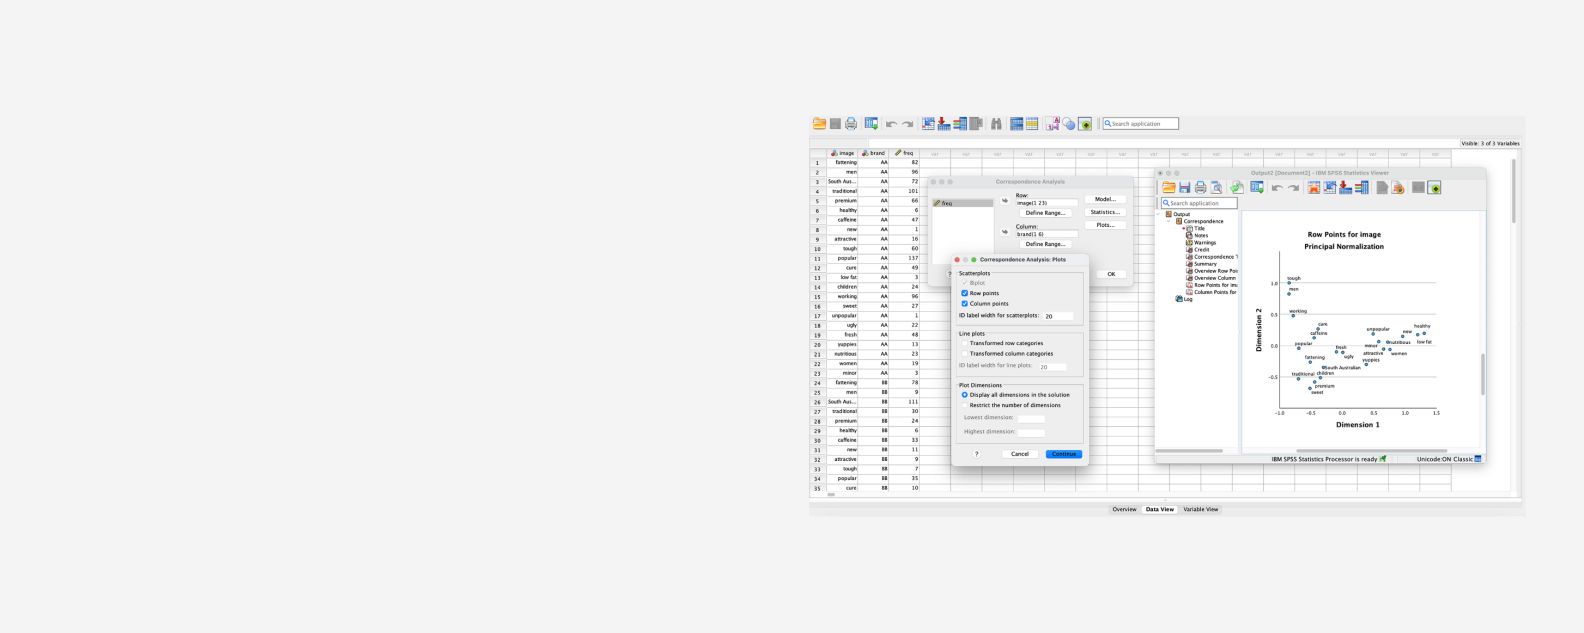
IBM® SPSS® Categories enables you to visualize and explore relationships in your data and predict outcomes based on your findings. It uses categorical regression procedures to predict the values of a nominal, ordinal or numerical outcome variable from a combination of numeric and ordered or unordered categorical predictor variables. The software features advanced techniques such as predictive analysis, statistical learning, perceptual mapping and preference scaling.
This module is included in the SPSS statistics professional edition for on premises, and in the “Complex sampling and testing” add-on for subscription plans.
Use correspondence analysis to more easily display and analyze differences between categories.
Incorporate supplementary information on additional variables.
Use symmetrical normalization to produce a biplot so you can better see associations.
Benefit from tools to help you analyze and interpret your multivariate data and its relationships more completely. For example, understand which characteristics consumers relate most closely to in terms of your product or brand, or determine customer perception of your products compared to other products that you or your competitors offer.
Predict the values of a nominal, ordinal or numerical outcome variable from a combination of numeric and ordered or unordered categorical predictor variables. Use regression with optimal scaling to describe, for example, how job satisfaction can be predicted from job category, geographic region and the amount of work-related travel.
Quantify variables so that the Multiple R is maximized. Optimal scaling may be applied to numeric variables when residuals are non-normal or when predictor variables are not linearly related with the outcome variable. Regularization methods such as ridge regression, lasso and elastic net can improve prediction accuracy by stabilizing the parameter estimates.
Use dimension reduction techniques to see relationships in your data. Summary charts display similar variables or categories to provide you with insight into relationships among more than two variables.
Techniques include correspondence analysis (CORRESPONDENCE), categorical regression (CATREG), multiple correspondence analysis (MULTIPLE CORRESPONDENCE), CATPCA, nonlinear canonical correlation (OVERALS), proximity scaling (PROXSCAL) and preference scaling (PREFSCAL).
- For on premises: Purchase the professional edition
- For Subscription plans: Purchase the “Complex sampling and testing” add-on
- Processor: 2 GHz or faster
- Display: 1024x768 or higher
- Memory: 4 GB of RAM required, 8 GB of RAM or more recommended
- Disk space: 2 GB or more