How To
Summary
Useful resource to get started with learning the Python Language
Objective

Assuming that you have a language or two under your belt then these notes are places to start and problems to avoid.
Environment
I am assuming that you are using UNIX, Linux, or even Windows.
Steps
Alternatives
- You could search Google, YouTube, and many other places and find a billion hits
- You can get swamped with options
- This article is Nigel's starter pack for a quick start.
- This information is what I found useful - Your needs can be different to mine!
What is Python good for?
- Data Scientist job & serious mega-bucks - You can double your already large salary!
- New new technology areas line PowerAI, Artificial Intelligence , Machine Learning, Deep Learning, and so on.
- Data manipulation to correct a files format and restructuring the data
- Web 2.0 web pages + REST API
How to develop code & run Python
- Edit file and run file
- IDE (integrated development environment)
- Initially IDE is a pain in the backside
- As you have to learn both the IDE and Language together
- Learning a IDE can take a month!
- But good for a full time developer
- I recommend: edit and run but also you can run the python in console mode to try out things.
- I have written Python code for about a year. I think I am ready to try a IDE to edit code and debugging.
- Probably the PyCharm Community Edition IDE for a start.
Environments
- Windows = yuck!
- Tablet - you can run PyCharms IDE but get yourself a Keyboard for typing.
- OSX = if you really have too! Sorry never really got on with the Mac
- Linux = is the natural home of Python. Although, AIX 7.3 comes with Python.
- I am using a 160 CPU, 256 GB RAM, POWER8 S922LC - rather overkill but it is fast :-)
- I also use a Raspberry Pi. For data files are not more than a GB it is quick. The Raspberry Pi memory is limited.
- AIX
- it is in the AIX Open Source toolbox for downloading
- take care with exotic modules as might have to use git & compile them yourself
How does Python run?
- Compiled - No like say C
- Interpreted - Yes but highly optimised, cached and parallelised. I have some Python code that finishes so fast I assumed it crashed but it does work.
Which Python version 2.7 or 3.x ?
- 3.<latest> - at the rime of writing 3.5 to 3.7 depending on how current your OS is!
- No one is writing 2.7 any more
- But there is lots of it in use today but declining over time
- Not a massive difference but best to learn Python 3
Quick Assumption: You have, in the past, written some of these languages?
- C, Korn or bash shell script writing: excellent
- C programming: brilliant
- JavaScript programs: good
- Python Programming: Why are you reading this article???
Then, you have already performance the heavy lifting.
Everyone can write a simple program!
A=42 print "The number is " $A if [[ $A == 42 ]] then print "eureka" fi
Plus For loop & Functions
What is this? Well is work on my Korn Shell OK on AIX.
Mega Tip 1: If you know any of the languages listed, then Python is going to be simple
- Updated Read the magic Python by Example or watch the video by the originator Derek Banas
- A big thanks for GjB in the comments for finding the link. I lost the link.
- YouTube link (which is includes a link to the code exam
ples ): - Approaching 5 million YouTube views - amazing for a techie video
- The video is 43 minutes and fast paced. A whole language with examples in under an hour.
- The web page dire
ctly : - Full marks to Derek Banas the content.
- Briefly the contents
- Data types:
- string,
- integers & float,
- tuples,
- lists,
- dictionary
- Converting between them
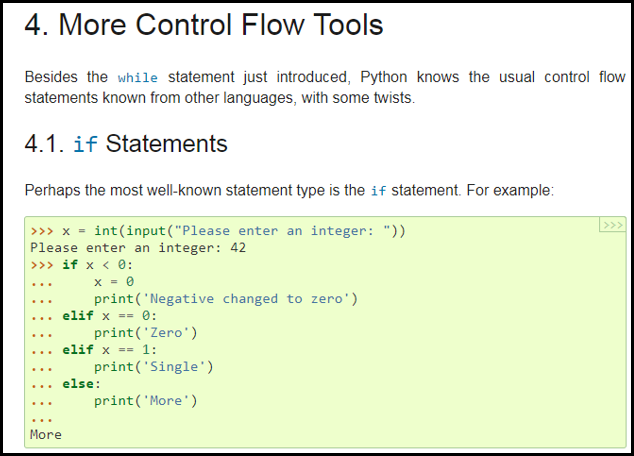
- Conditionals: if, then, else
- Loops: for, while
- Functions
- User input
- String manipulation
- File I/O: read and write
- Classes and objects
- Inheritance <-- IMHO advanced and for class module developers
- Polymorphism <-- IMHO advanced and for class module developers
Mega Tip 2: Socratica videos on YouTube
I have looks at many training course, Online content and YouTube series' and Socratica videos are by far the best and free.
-
Python Programming Tutorials (Computer Science)
-
Concise with dry humour and some computer jokes - see recursion
-
Mostly with worked example
-
Excellent style
-
Caltech grads
-
33 videos (Don't watch the two or three for Python2)
-
Most ~8 minutes
- Total 3.5 hours
- 15 million views
- YouT
ube Socr atic a Pl ayli st V ideo s - A Geek person told me Socraticia is the female form of Socrates - I think the creators are female. They also cover advanced maths and SQL topics.

- I watched all of these videos twice - about 6 months apart
- They are short but to consolidate what your learn try to have a quick go yourself on each topic
Mega Tip 3: python.org = This website is the Python Mother Ship!
- https://python.org
- Then, Download the Alternative Platforms
- For the official documentation go to https://docs.python.org/3/tutorial/
- Tiny example
- Also, if you are stuck for the syntax of a statement or the details of some module or function then use then Google: python3 <your questions spelt out in full>
- Often you get http://Python3.org but http
://s answer with worked examples is good but scan down the answer a bit (the first might not be the best answer or exactly what you want)tack over flow .co m
Mega Tip 4: Get yourself a project to force you to code and work though problems and new features
- Something simple
- Something you are interested in
- Specially web focused
- Python strong at
- Website interaction
- REST API to an online service
- Data manipulation and transformation
- File conversion or filtering
Mega Idiot: My first project was the REST API to a HMC to extract Temp, Watts + performance stats for SSP, server & VM
- It was a BIG mistake
- The bad news was the API was so badly documented it was impossible to use!
- With complicated XML - using features that are rarely used by anyone.
- I had to interview the developers in the end to workout the hidden details of the REST API
- In simple terms, it was the "REST API from Hell!"
- But I learnt a lot
- In the end, I wrote a Python class module to hid the horrible REST API from Python programmers - its 1100 line of code.
- It returns simple to use Python data structures
- So in simply ~40 lines of Python to extract, manipulate & save in:
- CSV file,
- .html with GoogleChart graphs
- Insert into an influxDB database
Mega Tip 5: JSON format files are the same as the Python native data type called Dictionaries
- When learning Python, concentrate on Dictionaries
- Dictionaries are (simple) { "some label": data, more here }
- and the data can be
- "Strings" in double or single quote
- Integers like 12345 or -42
- Floating point numbers 123.456 (note the decimal point)
- Often we have a list of dictionaries - lists look like [ item, item, item, . . . ]
JSON file example of stats called "mydata.json":
  # 1st sample = Python dictionary

{ "datetime": "2018-04-16T00:06:32",
"cpus_active": 32,
"mhz": 3521,
"cpus_description":
"PowerPC_POWER9.,
"cpu_util": {
    "user": 50.4,
    "sys": 9.0,
    "idle": 40.4,
    "wait": 0.2
  }
"disks": [
    { "name": "hdisk0", "size": 32, "busy": 12, "IOPS": 442 },
    { "name": "hdisk1", "size": 128, "busy": 44, "IOPS": 1587 }
  ]
}
Python Program to load the JSON data file - NEW Fixed a few Typos here, due to Cut'n'paste issues that is double quotes became full stops.
  # Read the file as plain text
f = open("mydata.json","r")
text = f.read()  f.close()

# convert to Dictionary
import json

#module to handle JSON format
jdata = json.loads(text)
- That json.loads() function converts a string (text) to the dictionary called jdata at 10's of MBs of JSON a second.
- Now lets extract certain fields that use a natural Python syntax
  # get the Mhz from the record
print("MHz=%d"%(jdata["mhz"]))
# Loop through all the records pulling out the MHz numbers and the CPU utilisation user mode percent (its in sub dictionary called cpu_util)

for sample in jdata["disks"]:
  print("Size=%d"%(sample["size"]))
My latest project that uses Python is njmon for AIX and Linux - the new turbo nmon.
-
The J is for JSON and we use Python to make data handling easy.
- For AIX uses libperfstat C library - if you want details see: man libperfstat on AIX or vi /usr/include/libperfstat.h
- Or find the worked example C code in KnowledgeCenter
- Status quirky but usable for expert C programmer
- Vast quantity of performance statistics (like 1000 for AIX and VIOS). If you have many disks, networks or ask for processes statistics then that grows rapidly.
- And for a bonus libperfstat gives us the current CPU MHz
- Similar for Linux
- njmon written in C to use C function into the UNIX kernel generates JSON data. Then, we use Python to accept the data and inject it live in to a Time Series Data fro graphing in real-time
Stand by for something strange
- "Well known" programming problem = swamping the values of two variables a and b. Classic solution is that use a temporary variable.
  temp = a
a = b
b = temp
- But can you do that without the temp variable?
- Not possible in C - I have known this for 40 years!
- Python answer
a,b = b,a
- It is using a native data structure called a tuple. As its a common programming task they built it into the language.
- Warning weirdness next:
-
How about this?
  a = a + b
b = a - b
a = a - b
-
Wow! I thought it was impossible!
Next a tiny Web grabbing Python example
- Lots of websites and web services keep stats that you can download with your browser.
- I have used sourcfogre.net (used below) and youtube.com for examples.
- They are most often in JSON and Python has a requests module that makes "talking" to website simple
- As an example bung this in your browser ( NOT Internet Explorer )
- And you should get a load of JSON date back that Firefox and Chrome will organise and make pretty.
- Using Python, requests module and one of my own for graphing we can draw t downloads from the nmon project on SourceForge over time
- We also need to change the date format from which shows of some of Pythons simple data manipulation
- ,[2018-09-17 00:00:00],2
- to
- ,['D
ate( 2018 ,9,1 7,00 ,00, 00)' , 2] - Below is the source code - with many extra print lines and comments so if you run it would will see the data structures.
- NEW Changes the code here to NOT relying on my nchart Python Module
- Green bits a debug but useful it you run it to see the data
- Red bits are the web-page pre-able and post-amble to setup the Googlechart library graph.
-
  #!/usr/bin/python3
#--------------------------------- Get the data using REST API from sourceforge.net
import requests
URL='https://sourceforge.net/projects/nmon/files/stats/json?start_date=2000-10-29&end_date=2020-12-04&os_by_country=false'

ret = requests.get(URL)
print(ret.status_code)
#print("return code was %d"%(ret.status_code))
#print("characters returned %d"%(len(ret.text)))

#---------------------------------- Create dictionay
import json
jdata = json.loads(ret.text)
#print(jdata)
months=0
count=0
for row in jdata['downloads']:
#    print(row)
  months=months+1
  count=count+row[1]
print("months=%d"%(months))
print("count =%d"%(count))

#---------------------------------- Create web page+graph using Googlechart library
file = open("downloads.html","w")
file.write('<html>\n'  '  <head>\n'
'    <script type="text/javascript" src="https://www.gstatic.com/charts/loader.js"></script>\n'
'    <script type="text/javascript">\n'
'      google.charts.load("current", {"packages":["corechart"]});\n'
'      google.charts.setOnLoadCallback(drawChart);\n'
'      function drawChart() {\n'
'        var data = google.visualization.arrayToDataTable([\n'
'[{type: "datetime", label: "Date"},"Files"]\n' )

for row in jdata['downloads']:
  str=row[0]
  str = str.replace("-",",")
  str = str.replace(" ",",")
  str = str.replace(":",",")
  file.write(",['Date(%s)',%d]\n"%(str,row[1]))

file.write('        ]);\n'
'  var options = {title: "nmon Downloads", vAxis: {minValue: 0}};\n'
'        var chart = new google.visualization.AreaChart(document.getElementById("chart_div"));\n'
'        chart.draw(data, options);\n'  '      }\n'  '    </script>\n'  '  </head>\n'
'  <body>\n'
'    <div id="chart_div" style="width: 100%; height: 500px;"></div>\n'
'  </body>\n'  '</html>\n')

file.close()
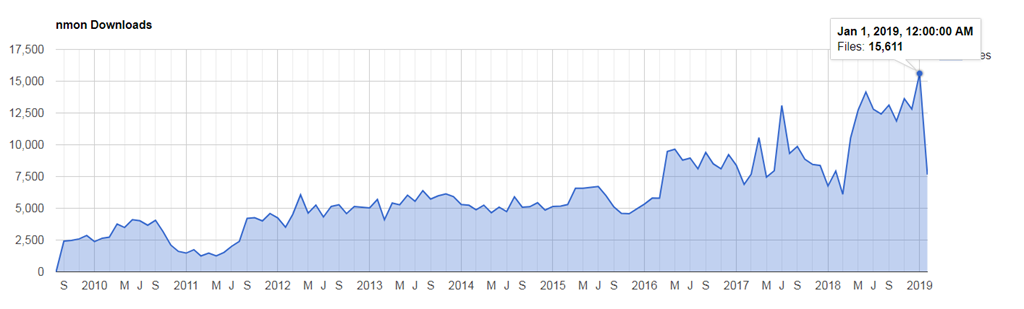
- The output - skipping the dump of the JSON and the 105 rows of monthly stats looks like this
  ['2018-05-01 00:00:00', 14153]
['2018-06-01 00:00:00', 12794]
['2018-07-01 00:00:00', 12422]
['2018-08-01 00:00:00', 13127]
['2018-09-01 00:00:00', 11872]
['2018-10-01 00:00:00', 13628]
['2018-11-01 00:00:00', 12805]
['2018-12-01 00:00:00', 15611]
months=114  count =686634
- So that was captured in Jan 2019 and so far 686,634 downloads of nmon and its tools and the monthly download generated graph.
- NEW The generated downloads.html file has the following contents - note I removed a few 100 lines of data in the middle. Colours are from the vim editor - see later comments.
- So that was captured in Jan 2019 and so far 686,634 downloads of nmon and its tools and the monthly download generated graph looks like this:
- NEW Simpler graph
C Programmers be aware:
I keep making the same mistakes in writing Python.
- On Linux with the right export TERM=linux setting and using vi (actually vim) then you have syntax highlighting which reduces errors a lot - go for a white background or comments in dark blue are unreadable. See the picture below - I have not done that colouring - it is all vim.
- vim also helps with auto indentation.
- If, for and while statements have a ":" at the end of the line.
- In Python it is print and in C it is printf - I had to teach my fingers to miss out the final "f"
- Those maddening 4 stop indentations have to be exactly right!
- Anything I missed?
Additional Information
Other places to find content from Nigel Griffiths IBM (retired)
Document Location
Worldwide
Was this topic helpful?
Document Information
Modified date:
31 December 2023
UID
ibm11114089