Troubleshooting
Problem
- "The accumulator was unable to aggregate all events or flows for this interval."
- "The accumulator has fallen behind. See Aggregated Data Management for details."
Symptom
Payload: [accumulator.accumulator] [AccumulationService] com.q1labs.cve.accumulation.AccumulationService:
[WARN] [NOT:0310004100][xxx.xxx.xxx.xxx/- -] [-/- -]Interval processing time (65 seconds) exceeded threshold (60 seconds)
Note: This error might cause certain dashboard items to display false or incomplete data.
Cause
Resolving The Problem
What are Global Views (GV) or Accumulated data?
Think of a Global View as a description of the data you want to be collected. In it, there is a description of the criteria that match the search and keys (columns) of the data you are interested in.
What are Virtual Views?
Virtual Views are like a database view. They are based on an existing description of data (Global View) and simply contain references to Columns in the Global View. Virtual Views are contained and described within a Global View and can be associated with only one Global View. They can reference only columns that are available in the Global View. To collect data for a column, a reference must be added to the column in a Virtual View.
Note: Virtual Views are the only way to collect data. Virtual Views can contain multiple references to a single column, when all references are gone the data collection stops.
What is Accumulated data?
Accumulated Data is an aggregate data view, used to draw a Time Series graph, or run Scheduled Reports, when you create a search that groups by 1 or more properties. We reference the data that is created by the term Global View. The Accumulator service runs on all appliances with local storage (Console, 16xx, 17xx, 18xx) to create the minute by minute accumulations. The accumulator_rollup service runs once per hour and creates the hourly roll-ups. At 12:15 AM, it creates the daily roll-up.
Global Views
Accumulated data, Global Views, Virtual Views, or Time Series, are commonly used terms in QRadar that basically mean the same thing. Which is aggregate data values that are created into 'global views', when a saved search, dashboard (time series graph) or scheduled report is requested (daily or longer). These aggregations are only created when your search, dashboard, or report is looking at data that is grouped by one or more data properties. When data is viewed in a group by (aggregate), we can create a 'rollup" or "total' values on a schedule. That same saved search used in a report, does not automatically show the time series in Log or Network Activity. You must still select the time series yourself to see the time series graph.Global views can get expensive when there are many 'unique values' in the global view or the search is not optimized.
For example, a global view exists when you create a search that groups by some property, such as 'Destination IP Address' or 'Destination Port'. If you think about common ports in use on a network, for services such as SMTP (25), WEB (80,443), SSH (22), they would be a few unique values. However, when you start talking about Destination IP Addresses, each server would be a unique value. If you then consider that a group by or aggregate can be on multiple properties, such as Destination IP Address and Destination Port, then you get a multiplying effect. A hundred hosts with ten ports each becomes a thousand unique objects. Then, if you think about someone doing a group by on say, 'Source IP Address' and 'Destination IP Address', that could be up into the thousands. If you added 'Destination Port' and maybe 'Web URL', that could get into the hundreds of thousands. This is how global view costs to process, create and can grow.
To find out which Views might be causing the accumulator to fall behind, you can run the following command on the Event Processor:
/opt/qradar/support/collectGvStats.sh -s | less
view[10094] time: 83748ms. Refs: {unknown}
view[10098] time: 82968ms. Refs: {unknown}
We want to look for the amount of time it takes for the GVs to load. In this case, it took over 80 seconds for EACH of the Global View listed in our example to load. Since QRadar has 60 seconds to load ALL Global Views, 80 seconds to load each Global View is excessive.
In this case, we need to find out which searches are associated with those views. To do that, you can run the following command but this time from the QRadar console.
/opt/qradar/support/collectGvStats.sh -m 10094
/opt/qradar/support/collectGvStats.sh -m 10098
Similar results to the following are returned:
view[10094]
Disk space usage of accumulated data for all hosts over the last 24 hours: 29.33 KB
searchtitle                  | reporttitle            | useradded
-----------------------------+------------------------+-----------
This is username1's search:  |                        | username1
This is username2's search:  |                        | username2
(2 rows)

view[10098]
Disk space usage of accumulated data for all hosts over the last 24 hours: 29.33 KB
searchtitle                  | reporttitle            | useradded
-----------------------------+------------------------+-----------
This is username1's search:  |                        | username1
This is username2's search:  |                        | username2
(2 rows)
Now, we know that the searches "This is username's1 search" and "This is username's2 search" are the culprits and needs to be tuned or optimized.
From here, look at the saved search in question to see how it can be tuned or optimized. We want to look at the 'Group By' properties as well as the Filters used in the search. Reducing the amount of 'Group By' or adding more filters is a great way to reduce the footprint of the Global Views. The order of the filters is important as well. We also recommend the use of Quick Filter instead of Payload Contains since it is more efficient. However, the Quick Filter is a "positive" filter and not "negative" and you can have one Quick Filter per search.
A good example of a search is as follows:
- Log in to the QRadar Console User Interface.
- Click the Log Activity tab.
- Click Search, New Search.
- Scroll to Column Definition.
- Remove Username from Columns.
- Add Username to Group By.
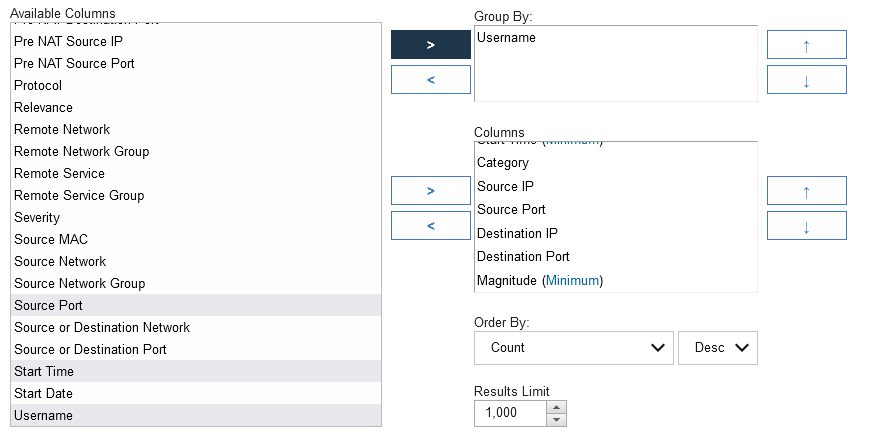
- Scroll to Search Parameters.
- Choose the following:
Parameter: Event Name [Indexed].
Parameter Type: Is.
Operator: Equal to.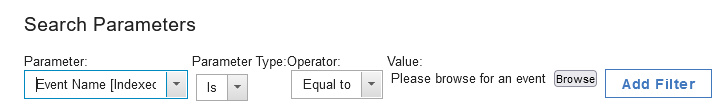
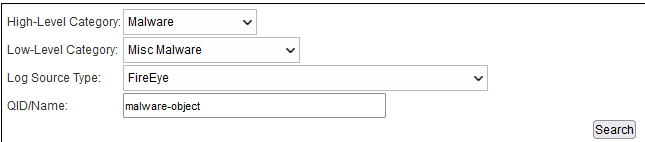
- Click Browse.
- In the High-Level Category select: Malware.
- In the Low-Level Category select: Misc Malware.
- In the Log Source Type, select: FireEye.
- In the QID/Name section type: malware-object.
- Click Search.
- Select one of the returned results.
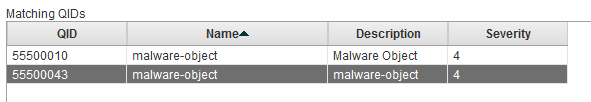
- Click OK.
- Click Add Filter.

- Click Search.
Another thing that might cause accumulator to fall behind is the number of views.
There might be views that have no search references that could be deleted. When a user creates a saved search or dashboard item and later deletes that saved search or dashboard item, the result is an empty view. These views are using up resources, and best practice for an administrator is to delete those views when they are no longer in use.You can find out which view has no search reference by running the following command on the console:
/opt/qradar/support/collectGvStats.sh -M | grep -B5 "0 rows" | less
Similar results to the following are returned:
view[10212]
Disk space usage of accumulated data for all hosts over the last 24 hours: 0 B
 searchtitle | reporttitle | useradded
-------------+-------------+-----------
(0 rows)
- In the QRadar Console UI, on the navigation menu (
 ), click Admin.
 - In the System Configuration section, click Aggregated Data Management.
- Change the Display to Aggregated Data View.

- From the list you can delete the view that has no search references, as seen in the ouput from the previous command result.
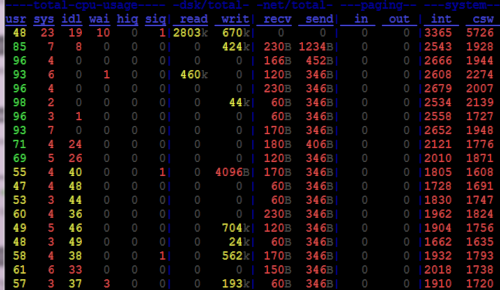
In this case, you can look at dstat command to see real-time disk IO, or look at the /var/log/systemStabMon/year/month/day/iostat_sda log file for historical result.
Related Information
Was this topic helpful?
Document Information
Modified date:
11 December 2023
UID
ibm10870446