Troubleshooting
Problem
The JVM Monitor tool in QMGTOOLS allows the user to monitor a JVM heap size and trigger a data collection that includes Job Watcher, Javacore, and Heapdump files. The purpose of this tool is to capture data in the case of intermittent issues where JVM heap size exceeds its normal value.
Resolving The Problem
1. If the QMGTOOLS toolkit has not yet been installed, you should refer to the following document for information on how to download and install the QMGTOOLS toolkit on your IBM i server. The following URL contains additional information: http://www-01.ibm.com/support/docview.wss?uid=nas8N1011297
Note: If you just downloaded the tool, this can be ignored. GO QMGTOOLS/MG and take option 12. Please make sure the build date is 03/21/2019 or later. If older than 03/21/2019, download the current version of QMGTOOLS by following the steps in : http://www.ibm.com/support/docview.wss?uid=nas8N1020468
2. The JVMMON utility can be found
GO QMGTOOLS/MG

Take option 7 for CTA/EWS

Take option 8 for Java menu
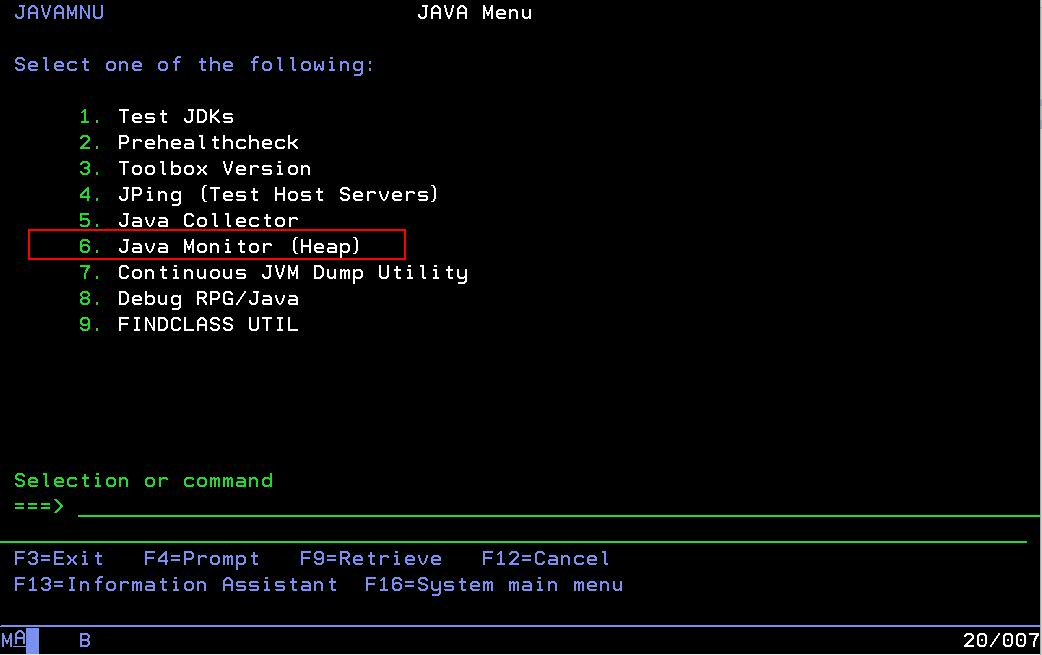
Take option 6 for Java Monitor

The above can also be entered directly with this command:
QMGTOOLS/JVMMON JOBNAME(ADMIN4) JOBUSER(QWEBADMIN) JOBNUM(123456) DUMPTYPE(J) STRJW(Y) JWLIB(JWDATALIB) TRIGVAL(2000000) SECONDS(900)
| JVMMON Parameters | |
| JOB NAME (JOBNAME) | The Name of the JVM |
| JOB USER (JOBUSER) | The User of the JVM |
| JOB NUMBER (JOBNUM) | The Number of the JVM |
| Dump Type (DUMPTYPE) | J= Javacore H=Heapdump B=BOTH |
| Start Job Watcher? (STRJW) | Indicate if Job Watcher is started. If this is Y, the JWLIB needs to be populated. If Y, it will gather JW data for the specific job into the JWLIB specified, for the amount specified in SECONDS. |
| Job Watcher Lib (JWLIB) | The library the Job Watcher data will be captured. |
| TRIGGER VALUE (TRIGVAL) | The size in KB that the monitor will trigger a heapdump, javacore, or both. This is the size of the ALLOCATED HEAP (Not heap in use) |
| SECONDS TO COLLECT (SECONDS) | The amount of time the JVMMON will monitor. If you wish to monitor a JVM for 30 minutes, you would specify 1800 seconds. |
| DELETE JAVACORE/HEAPDUMPS? (DELETE) | This JVMMON will automatically delete the javacore and heapdumps that reside in the IFS after the collection and the data is copied to /tmp/collectorscripts/data/JVMMON_%PID_%JOBNUM.zip |

The above screenshot shows the current heap size that gets monitored with JVMMON. If the JVM consumes a larter heap size than the current value, the collection will be triggered and the javacore and/or the heapdump is produced.
This screenshot shows an example of the joblog for the monitored JVM (ADMIN4 in this case) in which the javacore and heapdump is produced.

Once triggered the tool will zip the above heapdump* and javacore* files into
/tmp/collectorscripts/data/JVMMON_%PID_%JOBNUM.zip file. If DELETE(Y) is specified, it will then delete the javacore, heapdumps that it produced.
If JWLIB is specified, Job Watcher data will also be gathered for the JVM in question. This will be gathered for the length of time the tool runs.
Document Location
Worldwide
[{"Business Unit":{"code":"BU058","label":"IBM Infrastructure w\/TPS"},"Product":{"code":"SWG60","label":"IBM i"},"Component":"","Platform":[{"code":"PF012","label":"IBM i"}],"Version":"All Versions","Edition":"","Line of Business":{"code":"LOB57","label":"Power"}}]
Was this topic helpful?
Document Information
Modified date:
18 December 2019
UID
ibm10881938