General Page
Processing Application User Guide
-
Overview
-
Developing a Processing Application
-
Prerequisites
-
Quick Start Guide
-
-
Customizing the Event Processing
-
Selectors
-
Transformers
-
Elasticsearch Egress
-
Data anonymization
-
-
The Processing Configuration
-
Q&A
Overview
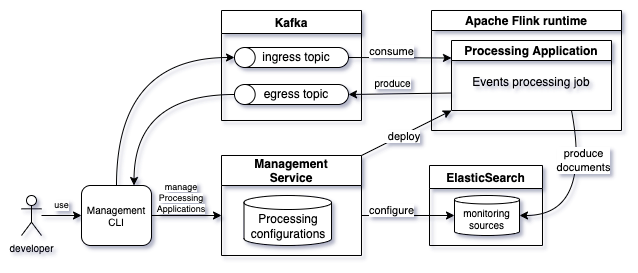
An Insights Engine Processing Application processes events to make them available to
the Monitoring Application, or to custom Kafka topics for downstream use to drive
automation, populate datalakes, and support other types of data storage.

The processing consists of transforming the events to extract and format the relevant
data to monitor based on business needs. The processing can be customized to select,
transform, and anonymize data.

The inbound events are read from a Kafka topic. As a result of this processing, the
documents are stored in Elasticsearch and/or events that are sent to other Kafka topics.

The Processing Application is also responsible for the following:

- Providing a Monitoring Source definition for the Monitoring Application to query
the relevant data stored in Elasticsearch. It has details on locating data to
build monitoring dashboards and charts.

- Defining an Elasticsearch mapping definition to customize how documents and fields
that it contains are stored and indexed within Elasticsearch.

Note: The content of the inbound events is always a JSON document.

[1] - Monitoring Application
The Insights Cockpit Monitoring Application is also known as Business Performance Center
(BPC) within IBM Business Automation Insights.


Custom Processing Application

The Processing Applications are managed by the Insights Management service. The
service provides you a command-line interface (CLI) to develop and test custom Processing
Applications. Using the CLI you can create, update and deploy a Processing Application.
It can also be used to produce inbound events and used events to check the results of
the Event Processing.

The Insights Engine Processing Application uses Apache Flink framework and runtime.
The Apache Flink framework and runtime requires to develop an Apache Flink
job from scratch. But with the Insights Engine Processing Applications, you do not
have to develop an Apache Flink job from scratch.

An Insights Engine Processing Application is defined by a unique name and a set of
configuration files. The Processing Configuration defines the source
and the destination of events, and how they are processed.

The configuration uses the JSLT scripting language to define the event
transformations: JSON fields matching, processing conditions, filtering.
Developing a Processing Application

Developing a Processing Application requires the Management service CLI and
involves the following steps:
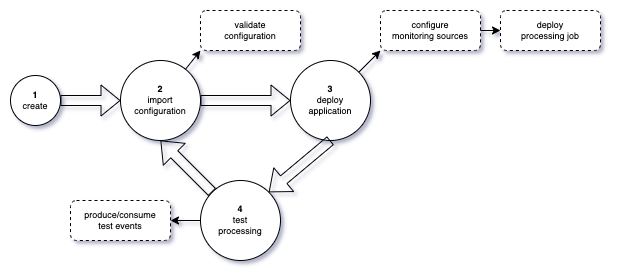
1. Create an application

You can declare an application that is identified with a unique name.
An application created cannot be deployed as-is, it requires a
valid configuration.


2. Define and import a valid configuration

The configuration must conform to the Processing Application specification.
When a configuration is imported, the Management service validates the
configuration to ensure that it conforms to the specification.


3. Deploy the application

An application can be deployed only if it has a valid configuration. Deploying an
application sets up the ElastiSearch monitoring sources (indices, aliases, mapping,
and so on) as in the configuration.

After the configuration is complete, it deploys and starts the Flink job. The job
also uses the configuration to consume and process events, produce ElasticSearch
documents and Egress events (if the configuration defines the Egress topics).


4. Test the processing

The CLI offers a convenient way to send events, you do not have to rely on a custom
event emitter to test your processing.

In the early stages of the development phase, it is recommended you define an Egress
topic and put the result of the processing within the topic. Using the CLI, you can
use the events to check the result of the processing.


Prerequisites

1. A development environment

- You have to deploy the IBM Business Automation Insights 21.0.3-IF009 or higher on
Kubernetes.

- You must set the Custom resource parameter "flink.additional_task_managers" to
"1" in order to deploy the Processing Application.

2. Download and install the Management Service CLI

- Refer the IBM Business Automation Insights 21.0.3 documentation for Installing
and using the management command-line interface.


Quick Start Guide


The quick start guide helps you with the following:

- Creating an application.
- Defining and importing its Processing Configuration.
- Sending test events and seeing the result in the Monitoring Application.

You will be creating a Processing Application named "test-app". The application reads
events from a Kafka topic and writes the result of the processing in an Elasticsearch
index. The configuration defines a simple Elasticsearch mapping to properly monitor
data in the Monitoring Application.

Review prerequisites, before you create an application.

Note: Kafka topic and Elasticsearch index names must be prefixed by the Cartridge name.

Examples in the following sections are based on a Cartridge named “icp4ba". If your
development environment was installed on a Cartridge with a different name, you have to
adapt the example accordingly and update topics and Elasticsearch index names to match the
Cartridge name of your target environment.

The exercise in the guide does not perform any specific transformation. Post completing the
sections in the guide, proceed to Customizing the Event Processing for events
transformation.


1. Create a Processing Application named "test-app"

The following command creates a Processing Application named "test-app". The management
service ensures that the name is valid and unique among the applications already
created.
management-cli processing-app create --name="test-app"
2. Define the Processing Configuration

The Processing Configuration of the "test-app" contains three files:

- processing-conf.json: It is the main configuration file, it defines Kafka Ingress and
Elasticsearch Ingress.
- elasticsearch-mapping.json: It contains the Elasticsearch mapping definition.
- monitoring-sources.json: It defines the Elasticsearch index to be monitored by
Cockpit.

You must create a dedicated folder named "test-app" along with these configuration
files:


test-app
  |__ processing-conf.json
  |__ elasticsearch-mapping.json
  |__ monitoring-sources.json


- processing-conf.json
{
  "ingresses": [
    {
      "uid": "I0001",
      "type": "kafka",
      "topic": "icp4ba-test-topic"
    }
  ],
  "egresses": [
    {
      "uid": "E0001",
      "type": "elasticsearch",
      "index": {
        "name": "icp4ba-test-index",
        "docId": {
          "type": "jslt-inline",
          "expression": ".id"
        },
        "mapping": {
          "filename": "elasticsearch-mapping.json"
        }
      }
    }
  ]
}
- monitoring-sources.json
[
  {
    "id": "test monitoring source",
    "elasticsearchIndex": "icp4ba-test-index"
  }
]
- elasticsearch-mapping.json
{
  "dynamic": true,
  "properties": {
    "id": {
      "type": "keyword"
    },
    "status": {
      "type": "keyword"
    },
    "timestamp": {
      "type": "date"
    }
  }
}
3. Import the Processing Configuration

The following command imports the Processing Configuration. The management service
validates the configuration to ensure it complies to the specification. In case
of validation errors, it returns the list of errors to help you fix the
configuration.
management-cli processing-conf import --name="test-app" --directory="./test-app"
4. Deploy the Processing Application

The following step applies the configuration: creates or updates Elasticsearch
indices/alias/mapping, Kafka topics and, monitoring sources to the Processing
Configuration. It requests the deployment to a dedicated Flink processing Job
that uses the configuration to process the events.
management-cli processing-app deploy --name="test-app"
You can check the status of the deployed processing job
with the following command:
management-cli processing-jobs list
5. Test the Processing Application

5.1 Send a test event:

1. Create a dedicated folder named "test-data":


   test-data
     |__ event.json
- event.json
{
  "id": "00001",
  "timestamp": "2021-10-28T09:05:12.737Z",
  "status": "ok"
}
2. Send an event by running the following command:
management-cli kafka producer-json --topic="icp4ba-test-topic" --file="./test-data/event.json"
Note: The "--topic" value must match the topic name that is defined in section Ingresses of
"processing-conf.json".

5.2 Check the result from the Monitoring Application

1. Log in to the Monitoring Application.

- Refer to Business Automation Insights documentation to access the Business Performance
Center application.

2. Create a new dashboard, named "Test application".

3. Create a chart, named "Periodic".

- Add a group by "status".

4. Create a chart, named "Data".

- In the Visualization tab, add data columns for each property.

5. Save your dashboard

With this, you have monitored your first event!

6. Send multiple events

You can define and send a batch of events to test more complex functional use cases
involving a set of multiple events.

1. Add the following file to your "test-data" folder:
- multiple-events.txt
{ "id": "00001", "timestamp": "2021-10-28T09:05:12.737Z", "status": "ok" }
{ "id": "00002", "timestamp": "2021-10-29T19:05:12.737Z", "status": "ok" }
{ "id": "00003", "timestamp": "2021-11-01T09:00:12.737Z", "status": "error" }
{ "id": "00004", "timestamp": "2021-11-01T10:05:12.737Z", "status": "ok" }
{ "id": "00005", "timestamp": "2021-11-01T11:05:12.737Z", "status": "ok" }
{ "id": "00006", "timestamp": "2021-11-01T12:05:12.737Z", "status": "error" }
{ "id": "00007", "timestamp": "2021-11-01T13:05:12.737Z", "status": "ok" }
{ "id": "00008", "timestamp": "2021-11-01T14:05:12.737Z", "status": "error" }
{ "id": "00009", "timestamp": "2021-11-02T10:05:12.737Z", "status": "ok" }
{ "id": "00010", "timestamp": "2021-11-02T12:05:12.737Z", "status": "ok" }
2. Run the following command, keeping a watch on the dashboard you created in the previous
step:
management-cli kafka producer-json --topic="icp4ba-test-topic" --file="./test-data/multiple-events.txt" --batch
While the events are sent, you can see the result in the Monitoring Application updating
the dashboard in real-time.

7. Clean up

When you deploy a Processing Application, the management service takes care of
creating or updating various resources declared in the Processing Configuration
such as Elasticsearch indices and Kafka topics. However, in the development phase
you might want to clean the result of the deployment of a Processing Application.

The Processing Application that you created is named "test-app", its Processing
Configuration file "processing-conf.json” refers to an Egress topic that is named
"icp4ba-test-topic" and an Elasticsearch index configuration named "icp4ba-test-index".

The following steps cleans all the resources:

1. Stop the processing of the application named "test-app".

2. Delete the topic named "icp4ba-test-topic".

3. Delete the Elasticsearch configuration of the indexnamed "icp4ba-test-index".

4. Finally, you can delete the Processing Application along with its configuration:
management-cli processing-app delete --name=test-app
Customizing the Event Processing

Each event is read from a Kafka topic. Each Egress instance can define a "selector" and a
"transformer".

Selectors

The "Selector" configuration defines how to filter the events. It prevents the events that
do not match the selector condition from being processed later.

Hands-on example

Objectives

In this example, you will process the "order" events from an Ingress Kafka topic,
filter out the orders with the status "ORDER_DONE" and write the result to an
Egress Kafka topic.

Sample data

samples/selector/data/order.events.txt
{ "id": "order_1", "kind": "order", "seq": 1, "timestamp": "2021-05-07T00:00:01.000-04:00", "status": "ORDER_CREATED" }
{ "id": "order_1", "kind": "order", "seq": 2, "timestamp": "2021-05-07T00:00:04.000-04:00", "status": "ORDER_PROCESSED", "data": { "shipped": true } }
{ "id": "order_1", "kind": "order", "seq": 3, "timestamp": "2021-05-07T00:00:07.000-04:00", "status": "ORDER_DONE", "data": { "paid": true } }
Configuration

samples/selector/conf/processing-conf.json
{
  "ingresses": [
    {
      "uid": "I0001",
      "type": "kafka",
      "topic": "icp4ba-order"
    }
  ],
  "egresses": [
    {
      "uid": "E0001",
      "type": "kafka",
      "topic": "icp4ba-order-completed",
      "enabled": true,
      "selector": {
        "type": "jslt-inline",
        "expression": "test(.status, \"ORDER_DONE\")"
      }
    }
  ]
}
Procedure

1. Create a Processing Application.
management-cli processing-app create --name="test-app"
2. Import the configuration.
management-cli processing-conf import --name="test-app" --directory=samples/selector/conf
3. Deploy the application.
management-cli processing-app deploy --name="test-app"
4. Use the events processed by the application to check the result of the processing.
Run the following command in a dedicated terminal:
management-cli kafka consumer-json --topic=icp4ba-order-completed
It must display the message "Retrieving events from topic icp4ba-order-transformed",
waiting to display events from the Egress topics.

5. Send the test events.
management-cli kafka producer-json --topic=icp4ba-order --batch --file=samples/selector/data/order.events.txt
Expected result

In the terminal where you started the Kafka "consumer-json" command, you must be
able to see the result from the Egress topic:
result:  Event read (key=null partition=0, offset=0/1):
   {"id":"order_1","kind":"order","seq":3,"timestamp":"2021-05-07T00:00:07.000-04:00","status":"ORDER_DONE","data":{"paid":true}}
Clean up

The following steps cleans all the resources:

1. Stop the processing of the application named "test-app".

2. Delete the Ingress and the Egress topics named "icp4ba-order" and
"icp4ba-order-selector" respectively.

3. You can now delete the Processing Application along with its configuration:
management-cli processing-app delete --name=test-app
Transformers

The "transformer" configuration defines how to perform the JSON to JSON transformation
on events. The result of the transformation is a JSON that can have a new structure
and/or more fields.

Hands-on examples

Objective

The objective of this exercise is to get the following JSON result, process, and
transform the "order" events from an Ingress Kafka topic:
{
  "order": "order_1",
  "status": "order created at 2021-05-07T10:59:12.790-04:00"
}
Sample data

samples/transformer/data/order.events.txt
{ "id": "order_1", "kind": "order", "seq": 1, "timestamp": "2021-05-07T00:00:01.000-04:00", "status": "ORDER_CREATED" }
{ "id": "order_1", "kind": "order", "seq": 2, "timestamp": "2021-05-07T00:00:04.000-04:00", "status": "ORDER_PROCESSED", "data": { "shipped": true } }
{ "id": "order_1", "kind": "order", "seq": 3, "timestamp": "2021-05-07T00:00:07.000-04:00", "status": "ORDER_DONE", "data": { "paid": true } }
Configuration

samples/transformer/conf/processing-conf.json
{
  "ingresses": [
    {
      "uid": "I0001",
      "type": "kafka",
      "topic": "icp4ba-order"
    }
  ],
  "egresses": [
    {
      "uid": "E0001",
      "type": "kafka",
      "topic": "icp4ba-order-transformed",
      "enabled": true,
      "transformer": {
        "type": "jslt-file",
        "filename": "transform.jslt"
      }
    }
  ]
}
samples/transformer/conf/transform.jslt
def status-message(status)
  if ($status == "ORDER_CREATED")
    "order created"
  else if($status == "ORDER_PROCESSED")
    "order being processed"
  else if($status == "ORDER_DONE")
    "order complete"
  else
    "unknown"

{
  "order": .id,
  "status": status-message(.status) + " at " + .timestamp
}
Procedure

1. Create a Processing Application.
management-cli processing-app create --name="test-app"
2. Import the configuration.
management-cli processing-conf import --name="test-app" --directory=samples/transformer/conf
3. Deploy the application.
management-cli processing-app deploy --name="test-app"
4. Use the events processed by the application to check the result of the processing.
Run the following command in a dedicated terminal:
management-cli kafka consumer-json --topic=icp4ba-order-transformed
It must display the message "Retrieving events from topic icp4ba-order-transformed",
waiting to display events from the Egress topics.

5. Send the events.
management-cli kafka producer-json --topic=icp4ba-order --file=samples/transformer/data/order.events.txt --batch
Expected result

You must be able to see the result from the Egress topic from the terminal where you
started the Kafka "consumer-json" command (step 4.):
Event read (key=null partition=0, offset=0/1): {"order":"order_1","status":"order created at 2021-05-07T00:00:01.000-04:00"}
Event read (key=null partition=0, offset=1/2): {"order":"order_1","status":"order being processed at 2021-05-07T00:00:04.000-04:00"}
Event read (key=null partition=0, offset=2/3): {"order":"order_1","status":"order complete at 2021-05-07T00:00:07.000-04:00"}
Clean up

The following steps cleans all the resources:

1. Stop the processing of the application named "test-app".

2. Delete the Ingress and the Egress topics "icp4ba-order" and "icp4ba-order-transformed"
respectively.

3. You can now delete the Processing Application along with its configuration:
management-cli processing-app delete --name=test-app
Elasticsearch Egress

An "Egress" configuration of the type "elasticsearch" allows writing the result of
the processing in an Elasticsearch index. The definition is required to monitor the
data through the Cockpit application.

An "elasticsearch" Egress configuration defines the following:

- The target index name (required).

- The Elasticsearch document id (required). To create, use a transformation to define
the value of the document id.

- A definition of the Elasticsearch mapping must be applied to the index (optional).
You can use this if you are not ok with Elasticsearch dynamic mapping. Refer here for more
information.

Hands-on example

Objectives

The objective of this exercise is to:

- Process order events from an Egress Kafka topic.
- Write the content of each event as a document in Elasticsearch.
- To ensure that each document has a unique id
- Set the document id as the concatenation of the event ".id" and ".seq".
- To use the default mapping.
- Declare a monitoring source and monitor the result of the processing through the
Monitoring Application.

Sample data

samples/elasticsearch/data/order.events.txt
{ "id": "order_1", "kind": "order", "seq": 1, "timestamp": "2021-05-07T00:00:01.000-04:00", "status": "ORDER_CREATED" }
{ "id": "order_1", "kind": "order", "seq": 2, "timestamp": "2021-05-07T00:00:04.000-04:00", "status": "ORDER_PROCESSED", "data": { "shipped": true } }
{ "id": "order_1", "kind": "order", "seq": 3, "timestamp": "2021-05-07T00:00:07.000-04:00", "status": "ORDER_DONE", "data": { "paid": true } }
Configuration

samples/elasticsearch/conf/processing-conf.json
{
  "ingresses": [
    {
      "uid": "I0001",
      "type": "kafka",
      "topic": "icp4ba-order"
    }
  ],
  "egresses": [
    {
      "uid": "E0001",
      "type": "elasticsearch",
      "index": {
        "name": "icp4ba-order-series",
        "docId": {
          "type": "jslt-inline",
          "expression": ".id + \"#\" + .seq"
        }
      }
    }
  ]
}
samples/elasticsearch/conf/monitoring-sources.json
[
  {
    "id": "Orders",
    "elasticsearchIndex": "icp4ba-order-series"
  }
]
Procedure

1. Create a Processing Application.
management-cli processing-app create --name="test-app"
2. Import the configuration.
management-cli processing-conf import --name="test-app" --directory=samples/elasticsearch/conf
3. Deploy the application.
management-cli processing-app deploy --name="test-app"
4. Send the events.
management-cli kafka producer-json --topic=icp4ba-order --file=samples/elasticsearch/data/order.events.txt --batch
5. Check the content of the index.

    - Refer How to retrieve Elasticsearch information to set the variables "esUser",
"esPwd" and "esUrl".

    - Set "paIndexName=icp4ba-order-series", the name of the index defined in the
Processing Application's Egress.

       - To check the number of documents:
curl -sku ${esUser}:${esPwd} ${esUrl}/${paIndexName}-ibm-bai/_count | jq
- To check the content of the index:
curl -sku ${esUser}:${esPwd} ${esUrl}/${paIndexName}-ibm-bai/_search | jq
Expected result

You must be able to get three documents and the document should look like the following:
  {
    "_index": "icp4ba-order-completed-idx-ibm-bai-2022.01.12-000001",
    "_type": "_doc",
    "_id": "order_1#3",
    "_score": 1,
    "_source": {
      "id": "order_1",
      "kind": "order",
      "seq": 3,
      "timestamp": "2021-05-07T00:00:07.000-04:00",
      "status": "ORDER_DONE",
      "data": {
        "paid": true
      }
    }
  }
Visualize the result of the processing

The configuration defines a monitoring source. It allows you to visualize the result
of the processing written in ElasticSearch through dashboard charts.

1. Log in to the Monitoring Application
    - Refer to the Business Automation Insights documentation to access the Business
Performance Center application.

2. Create a new dashboard, named "Orders".

3. Create a chart, type "Period metric". Named as "Periodic".
   - Monitoring source: "Orders - ALL".
   - Add a group by "status".

4. Create a chart, type "Data". Named as "Data".
    - In the Visualization tab, add data columns for each property.

5. Save your dashboard.

Clean up

The following steps cleans all the resources:

1. Stop the processing of the application named "test-app".
2. Delete the Ingress topic named "icp4ba-order".
3. Delete the Elasticsearch configuration of the index named "icp4ba-order-series".

Data anonymization

The Insights Engine provides in-built JSLT functions to anonymize event data. To use
these functions, you must import the JSLT library "ibm-bai-utils.jslt" in a custom
JSLT file that is referenced in a "transformer".

Input "obj" are used in the following examples:
{
  "id" : "w23q7ca1-8729-24923-922b-1c0517ddffjf1",
  "firstName" : "John",
  "lastName" : "Doe",
  "personal.ssn" : "999-999-999",
  "personal.id" : "9999999",
  "maritalStatus": "single"
}
Obfuscating data with stars

Function: "obfuscate-stars-regex(regex, obj)"

Replace the property value with stars "*". It preserves the length of the replaced
values. All the object properties from "obj" that match the regular expression
"regex" is updated. This is a nonreversible update.

Example 1: Single property

Transformer
import "ibm-bai-utils.jslt" as ie

{
  "displayName" : .firstName + " " + .lastName,
} + ie.obfuscate-stars-regex("personal.ssn",.)
Result:
{
  "id" : "w23q7ca1-8729-24923-922b-1c0517ddffjf1",
  "firstName" : "John",
  "lastName" : "Doe",
  "personal.ssn" : "***-***-***",
  "personal.id" : "9999999",
  "maritalStatus" : "single",
  "displayName" : "John Doe"
}
Example 2: Multiple properties (single regexp)

Transformer:
import "ibm-bai-utils.jslt" as ie

{
  "displayName" : .firstName + " " + .lastName,
} + ie.obfuscate-stars-regex("personal.*",.)
Result:
{
  "id" : "w23q7ca1-8729-24923-922b-1c0517ddffjf1",
  "firstName" : "John",
  "lastName" : "Doe",
  "personal.ssn" : "***-***-***",
  "personal.id" : "*******",
  "maritalStatus" : "single",
  "displayName" : "John Doe"
}
Example 3: Multiple regexp

Transformer:
import "ibm-bai-utils.jslt" as ie

{
  "displayName" : .firstName + " " + .lastName,
} + ie.obfuscate-stars-regex("personal.*|maritalStatus",.)
Result:
{
  "id" : "w23q7ca1-8729-24923-922b-1c0517ddffjf1",
  "firstName" : "John",
  "lastName" : "Doe",
  "personal.ssn" : "***-***-***",
  "personal.id" : "*******",
  "maritalStatus" : "******",
  "displayName" : "John Doe"
}
Hashing data with SHA-256

Function: "obfuscate-sha256-regex(regex, obj)"

Replace the matching property value with the result of the "sha-256" hash value.
All object properties from the "obj" that match the regular expression "regex" are
updated. It does not preserve the length of the replaced values. This is a
nonreversible update of the value.

Example

Transformer:
import "ibm-bai-utils.jslt" as ie

{
  "displayName" : .firstName + " " + .lastName,
} + ie.obfuscate-sha256-regex("personal.*",.)
Result:
{
  "id" : "w23q7ca1-8729-24923-922b-1c0517ddffjf1",
  "firstName" : "John",
  "lastName" : "Doe",
  "personal.ssn" : "3360b177c3116188382fbd11cdfa854c2738cf1f785a8dca8bf5fbcc2122619e",
  "personal.id" : "b7e60b19dbf9d2bcb319ba66eec45eb9c67f205f537f36ec18f2896f9febb742",
  "maritalStatus" : "single",
  "displayName" : "John Doe"
}
Encoding data with Base64

Function: obfuscate-base64-regex(regex, obj)

Encode the matching property value in "Base64". All the object properties from
"obj" that match the regular expression "regex" are updated. It does not preserve
the length of the replaced values. This is a reversible update of the value.

Example

Transformer:
import "ibm-bai-utils.jslt" as ie

{
  "displayName" : .firstName + " " + .lastName,
} + ie.obfuscate-base64-regex("maritalStatus",.)
Result:
{
  "id" : "w23q7ca1-8729-24923-922b-1c0517ddffjf1",
  "firstName" : "John",
  "lastName" : "Doe",
  "personal.ssn" : "999-999-999",
  "personal.id" : "9999999",
  "maritalStatus" : "c2luZ2xl",
  "displayName" : "John Doe"
}
The Processing Configuration

The Processing Configuration is made of a specific set of files. The
"processing-conf.json" is the main configuration file and is mandatory to have.
In this file, you define the sources and the destinations of events and how they
are processed. It can refer to other files such as JSLT transformation definitions,
and ElasticSearch mapping definitions.

The Processing Application provides a Monitoring Source definition for the monitoring
application to query the relevant data stored in Elasticsearch. The Monitoring sources
are defined in the file "monitoring-sources.json". It has details on locating data to
build monitoring dashboards and charts.

All the event data manipulation (selection, transformation) is done through JSLT
scripting. A JSLT expression can be declared directly in "processing-conf.json"
as a property value (inline) or in a dedicated file. In the latter case, a
"processing-conf.json" property refers to the file name (which must have the
".jslt" extension).

processing-conf.json

The "processing-conf.json" file follows a script specification. It is validated
against a schema when you import a Processing Configuration. It defines “Ingresses"
(inbound events sources) and "Egresses" (how to handle events along to outbound
destinations).

Example:
{
  "ingresses": [
    {
      "uid": "I0001",
      "type": "kafka",
      "topic": "icp4ba-order-ingress"
    }
  ],
  "egresses": [
    {
      "uid": "E0001",
      "type": "kafka",
      "enabled": true,
      "topic": "icp4ba-order-egress"
    },
    {
      "uid": "E0002",
      "type": "elasticsearch",
      "index": {
        "name": "icp4ba-orders",
        "docId": {
          "type": "jslt-inline",
          "expression": ".id"
        },
        "mapping": {
          "filename": "orders-mapping.json"
        }
      },
      "selector": {
        "type": "jslt-file",
        "filename": "event-selector.jslt"
      },
      "transformer": {
        "type": "jslt-file",
        "filename": "event-transformer.jslt"
      }
    }
  ],
  "settings": {
    "verboseLogs": true
  }
}
Expected configuration files would be:
<configuration directory>
   |-- processing-conf.json
   |-- orders-mapping.json => custom ElasticSearch mapping
   |-- event-selector.jslt => custom jslt, referenced by processing-conf.json
   +-- event-transformer.jslt => another custom jslt, referenced by processing-conf.json
Unique ID

The Ingress and Egress instances require a unique ID ("uid") within the processing
configuration. This ID allows identifying underlying processing Job operators.

The length of the "uid" must be "5". A length of up to "36" is authorized for
compatibility reasons but is deprecated. While the value of a "uid" is free, by
convention all Ingress "uid" start with "I", all Egress start with "E" and a number
to identify the instance.

You must not change the "uid" after you set it. This identifier is used to upgrade
the processing when you redeploy your application with the configuration changes. It
is assigned to a Flink operator to manage the Flink job recovery through checkpoints
and savepoints. As a consequence after a "uid" is set in the processing configuration,
it must not be changed. Otherwise, the Flink job fails to recover from the checkpoints
and savepoints previously generated as they will not match.

Ingress

The Processing Configuration must define only one Ingress instance.

- uid: [Required] A unique identifier within the Processing Configuration.
- type: [Required] The only  supported value is "kafka".
- topic: [Required] Name of the Kafka topic to consume inbound events from.

Egress

The Processing Configuration must define at least one Egress instance.

- uid: [Required] A unique identifier within the Processing Configuration.
- type: [Required] Supported types are "kafka" and "elasticsearch".
- settings
    - verboseLogs: [Optional] It is set to "true" to force the processing job to log
additional information (Default is "false").
    - elasticsearch: [Optional]
        - bulk.flush.max.actions: [Optional] Maximum number of actions to buffer before
flushing (Default is "1").
        - bulk.flush.interval.ms: [Optional] Interval at which to flush regardless of
the number of buffered actions (Default is "-1").

With "type: kafka"

- topic: [Required] Name of the Kafka topic to produce outbound events to.
- enabled: [Optional] Indicates if this Egress is enabled. (Default is "false")

With "type: elasticsearch"

- index: [Required]
    - name: [Required] The name of the index where the result of the processing is written.
    - docID: [Required] A JSLT expression that must return, for the event being processed,
the value that must be used as the Elasticsearch document Id.
        - type: Indicates whether the jslt expression is a file ("jslt-file") or as a
string value ("jslt-inline")
            - filename: [Required with "type: jslt-file"] Name of the file that contains
the jslt expression. File extension must be ".jslt".
            - expression: [Required with "type: jslt-inline"] Inline jslt expression.
    - mapping: [Optional] A mapping definition to apply to new indices. If the index
template exists with a different mapping, the template mapping is updated, and a
rollover happens. The new active index applies the new mapping to document created
from the Egress.
        - type: "elasticsearch".
            - filename: [Required with "type: elasticsearch"] Name of the JSON file that
contains the elasticsearch mapping definition. File extension must be ".json".
    - settings: [Optional] Elasticsearch settings to apply to new indices.
        - index.number_of_shards: Number of shards.

monitoring-sources.json

monitoring-sources.json - An optional file in which a Processing Application can define
its monitoring sources.

Example:
[
  {
    "id": "Orders",
    "elasticsearchIndex": "icp4ba-orders"
  },
  {
    "id": "Shipments",
    "elasticsearchIndex": "icp4ba-shipments"
  }
]
- id: A unique identifier/name to identify the monitoring source when you create dashboards /charts.
- elasticsearchIndex: Refers to the Elasticsearch index configuration name defined in the
"processing-conf.json".
Q&A

1. How to install the management service CLI?
2. How to retrieve Management Service connection information?
3. How to retrieve Elasticsearch connection information?
4. How to stop the processing?
5. How to clean the deployment of a Processing Application?
    5.1 How to delete a topic?
    5.2 How to delete an index configuration?
6. How to get the Kafka connection information to configure a custom events emitter?
1. How to install the management service CLI?
The Management service requires "Java 11", "Bash 3.2", "curl 7", and "jq 1.5", or later versions, which must be installed on
your workstation.
1. Set a variable "destDir" to the path where you want to install the CLI. The directory must exist.
- Example: mkdir cli && destDir="cli"
- Example: mkdir cli && destDir="cli"
2. Download and extract the CLI from the management service (Refer How to retrieve Management Service connection information to determine the url and credential of the management service).
curl -k ${managementUrl}/cli -o ${destDir}/insights-engine-cli.tgz
tar xf ${destDir}/insights-engine-cli.tgz -C "${destDir}"
3. Update your "PATH".
export PATH=${destDir}:$PATH
4. Login.
management-cli env login --management-url=${managementUrl} --management-username=${managementUser} --management-password=${managementPwd}
5. Run the following commands to check the status and version.
management-cli env info
- "result.health.status" must be "0". - "result.health.build" (the build information from the management service) and "result.cliBuild" (the build information of
the CLI) must match Type "management-cli help" to know more about other available commands.
2. How to retrieve Management Service connection information?
1. Log in to the cluster and namespace where BAI/Insights is installed.
2. Run the following commands:
    ieInstanceName=$( oc get InsightsEngine --output=name)
    managementAuthSecret=$(oc get ${ieInstanceName} -o jsonpath='{.status.components.management.endpoints[?(@.scope=="External")].authentication.secret.secretName}')

    managementUrl=$(oc get ${ieInstanceName} -o jsonpath='{.status.components.management.endpoints[?(@.scope=="External")].uri}')
    managementUser=$(oc get secret ${managementAuthSecret} -o jsonpath='{.data.username}' | base64 -d)
    managementPwd=$(oc get secret ${managementAuthSecret} -o jsonpath='{.data.password}' | base64 -d)

    echo "Management service URL: ${managementUrl}"
    echo "Management service credentials: ${managementUser} / ${managementPwd}"
3. How to retrieve Elasticsearch connection information?
1. Log in to the cluster and namespace where BAI/Insights is installed.
2. Run the following commands:
2. Run the following commands:
   cartridgeRequirementName=$(oc get CartridgeRequirements --no-headers=true | awk '{print $1;}')

   elasticSearchStatus=$(oc get CartridgeRequirements $cartridgeRequirementName -ojson | jq '.status.components["elasticsearch"].endpoints[] | select(.scope=="External" and .caSecret != null)')
   elasticSearchSecret="$(echo ${elasticSearchStatus} | jq -r '.authentication.secret.secretName')"

   esUrl="$(echo "${elasticSearchStatus}" | jq -r '.uri')"
   esUser="$(oc get secret ${elasticSearchSecret} -ojson | jq -r '.data.username | @base64d')"
   esPwd="$(oc get secret ${elasticSearchSecret} -ojson | jq -r '.data.password | @base64d')"

   echo "Elasticsearch URL: ${esUrl}"
   echo "Elasticsearch credentials: ${esUser} / ${esPwd}"
4. How to stop the processing?
When you deploy an application, a processing job (Flink job) is eventually started. Run the following commands to stop it:
1. List the jobs to identify the one that matches your application name and whose state is "running".
management-cli processing-jobs list
2. If you found a match, use the job ID to cancel the job:
management-cli processing-jobs cancel --job-id=<job-id>
3. The cancel operation is synchronous. Ensure that the state is switched to "CANCELED", using the command from step 1.
5. How to clean the deployment of a Processing Application?
In the development phase, you might have created an application to test its configuration. Deleting a Processing Application, deletes its definition along with the configuration. However, the Elasticsearch index or the Kafka topic that is created by the application does not get deleted. If the application is already running, the deletion of the application will not stop it. You must manually stop the processing job. See How to stop the processing.
5.1 How to delete a topic?
Prerequisite: Before you delete a topic, the processing job must be stopped.
1. List the topics (filtered by Insights Engine topics) to confirm the name of the topic that you want to delete.
management-cli kafka list-topics
You might also issue the command "oc get KafkaTopics" (displayed list is unfiltered).
2. Delete the topic.
oc delete KafkaTopics <topic-name>
5.2 How to delete an index configuration?
Prerequisite: Before you delete the index configuration, stop the processing job. You also need to know the
Elasticsearch connection information.
Elasticsearch connection information.
The deletion of an index configuration consists of deleting the indices, aliases, and the index template that is related to
the index name declared in the Processing Configuration. The following procedure is meant to be used in Development
Phase - it deletes all the data for that particular index. Use with care.
1. Set the variable "paIndexName" with the name of the index declared in the Processing Configuration.
2. Identify one or more indexes instance names to delete.
curl -sku ${esUser}:${esPwd} ${esUrl}/_cat/indices/${paIndexName}-idx-*?h=index
3. Delete each index:
   indexInstanceName=<index_instance_name>
   curl -sku ${esUser}:${esPwd} -XDELETE ${esUrl}/${indexInstanceName}
4. Identify the index template name.
curl -sku ${esUser}:${esPwd} ${esUrl}/_cat/templates | grep ${paIndexName} | awk '{print $1;}'
5. Delete the template.
   templateName=<template_name>
   curl -sku ${esUser}:${esPwd} -XDELETE ${esUrl}/_template/${templateName}
6. How to get the Kafka connection information to configure a custom events emitter?
Custom event emitters require configuration that matches the actual Kafka configuration from IBM Automation foundation.
Refer here, for more information about retrieving details on connecting to Kafka.
Refer here, for more information about retrieving details on connecting to Kafka.
[{"Type":"MASTER","Line of Business":{"code":"LOB45","label":"Automation"},"Business Unit":{"code":"BU059","label":"IBM Software w\/o TPS"},"Product":{"code":"SSBYVB","label":"IBM Cloud Pak for Business Automation"},"ARM Category":[{"code":"a8m0z000000brBqAAI","label":"Operate-\u003EBAI Install\\Upgrade\\Setup-\u003EBAI Installation"}],"ARM Case Number":"","Platform":[{"code":"PF025","label":"Platform Independent"}],"Version":"All Versions"}]
Was this topic helpful?
Document Information
Modified date:
14 July 2022
UID
ibm16592193