White Papers
Abstract
This article details various techniques for managing performance across the DVM server, parallelism, zIIP utilization, and query execution. The article can refer to other supporting published documents, such as Capacity Planning and Deployment.
Content
Performance Tuning and Query Optimization
The DVM server optimizes the allocation and use of resources for processor types (General, zIIP) and system memory. Every resource has an impact on the environment in how it is used when running various of workloads.
Parallel I/O, MapReduce capability, block-fetch, and memory caching all require memory, to obtain optimal performance for workloads. For example, the maximum no. of parallel threads possible for a DVM server depends on the no. of zIIP specialty engines available, in combination with available system memory. Similarly, block-fetch of data into system memory requires adequate allocation of cache to improve execution time in accessing data in memory versus more I/O cycles associated with data retrieval from disk.
A general slide rule applies between zIIP specialty engines and General Processors. DVM allows for the ability to throttle processing between two types of processors, whereby zIIP engine processing is restricted. An increase of processing naturally occur on the General Processors. To reduce the MSU consumption for the system, your environment needs to ensure you have adequate zIIP engines to shift workloads and reduce the overall costs for processing.
The best recommendation for an initial installation is to focus on a standard resource allocation of two zIIP engines and 32 Gigabytes of memory for a 1-2 General Processor configuration. Starting with a balanced resource plan simplifies monitoring resource allocation that use SMF72 record types. The Resource Group data section of the SMF 72 record provides information about MIN/MAX capacity across various resource groups.
- % LPAR share
- % Processor capacity
- Memory limit
- MSU/H
Combined GP and zIIP consumption
As workloads are introduced through the DVM server, adjustments to resources can be made to allocate processing and memory to ensure optimal performance. Test results conducted at the IBM Systems Benchmark Center demonstrating the direct impact increasing numbers of zIIP engines have on parallelism. Performance improves significantly with reduced elapsed time to execute workloads, as shown in Table 1 and Table 2.
As workloads are introduced through the DVM server, adjustments to resources can be made to allocate processing and memory to ensure optimal performance. Test results conducted at the IBM Systems Benchmark Center demonstrating the direct impact increasing numbers of zIIP engines have on parallelism. Performance improves significantly with reduced elapsed time to execute workloads, as shown in Table 1 and Table 2.
| Server | Total CPU Time | Total zIIP Time | Total IICP Time | Total zIIP NTime | % zIIP eligible |
|---|---|---|---|---|---|
| DVM1 | 7099.33 | 5609.55 | 1389.58 | 5609.55 | 98.59% |
Table 1. zIIP engine exploitation
|
Test #
|
GPPs
|
# zIIP Engines
|
Degree of Parallelism | Elapsed Time (ms) |
SMT
|
|---|---|---|---|---|---|
| 1 | 8 | 0 | 0 | 118.96 | 1 |
| 2 | 8 | 5 | 0 | 98.68 | 1 |
| 3 | 8 | 5 | 4 | 27.05 | 1 |
| 4 | 8 | 5 | 8 | 17.14 | 1 |
| 5 | 8 | 5 | 8 | 20.84 | 2 |
| 6 | 8 | 5 | 10 | 17.00 | 2 |
| 7 | 8 | 5 | 16 | 15.73 | 2 |
| 8 | 8 | 8 | 8 | 13.83 | 1 |
| 9 | 8 | 8 | 8 | 17.62 | 2 |
| 10 | 8 | 8 | 16 | 11.72 | 2 |
Table 2 - Performance with parallelism and zIIP engine exploitation
This test was run against an older z13 machine that uses 800 Gigabytes of financial data. The test achieved approximately 99% offload to zIIP specialty engines. However, tests #2 and #4 execute against identical system resources where the degree of parallelism is set to a value of 8, resulting in a reduction of elapsed time from 98.68 minutes to 17.14 minutes.
Increasing the number of zIIP specialty engines from 5 - 8 further reduced the overall elapsed time to 13.83 minutes. Increasing both the number of zIIP engines and the degree of parallelism within the DVM Server can result in performance improvements up to 1,000% for elapsed times. The recommendation is to start small and expand the use of more resources to meet business objectives around latency and execution time.
Parallel I/O and MapReduce
DVM for z/OS optimizes performance by using a multi-threaded z/OS-based runtime engine that leverages parallel I/O and MapReduce capabilities to simultaneously fetch data from disk or memory. Figure 1 illustrates the DVM server parallelism by using MapReduce.
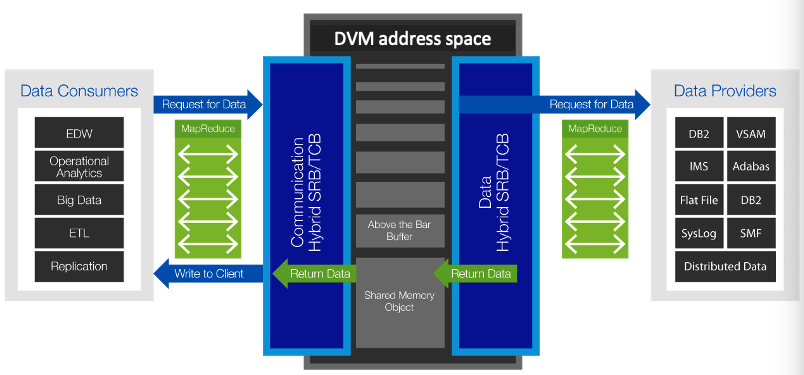
Figure 1 - DVM server parallelism achieved using MapReduce
MapReduce reduces query elapsed time by splitting queries into multiple threads that read large files in parallel. Each interaction, whether initiated by a distributed data consumer or application platform, runs under the control of a separate z/OS thread. A thread is a single flow of control within a process.
The DVM Server can deliver predicate pushdown and filtering to all data sources and supports heterogeneous JOINs with associated pushdown processing of filters for subqueries and their respective sources.
Virtual Parallel Data (Cache)
Virtual Parallel Data (VPD) essentially provides a means to cache data into defined members for faster and more optimal subsequent queries. Similar to other cache mechanisms, data is initially populated and persisted as a materialized view that can repetitively access by client applications and refreshed as needed to maintain currency for the business. This cache benefits by having to perform disk I/O once to populate the cache, therefore, reducing associated expense.
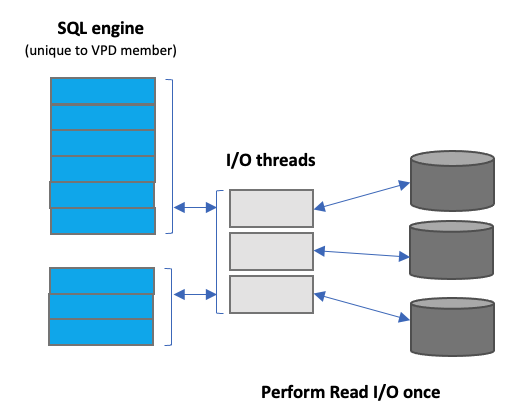
Figure 2 - DVM Virtual Parallel Data
VPD allows applications or users to group multiple simultaneous requests against the same data source in parallel without subsequent data refreshes. This functionality also allows single or multiple requests to run with asymmetrical parallelism, separately tuning the number of I/O threads and the number of client or SQL engine threads.
Using Virtual Parallel Data groups
All requests submitted against the same DVM Server instance need to refer to a group name. VPD groups also have a predefined amount of time for the group to persist. One or more I/O threads begin to read the data source and then write to a circular buffer assigned to the VPD group. Group members share buffered data without having to read directly from the disk.
I/O threads are started as soon as the VPD group is created, and data begins to flow to the buffer. If the buffer fills before the group is closed, the I/O threads wait. Once the group is closed and active members begin consuming data, the buffer space is reclaimed, and I/O continues.
Example
A large PS (single flat file) is on disk that the customer doesn’t want to read more than once for operational and performance reasons. Instead, the customer wants to import the content of the file into multiple data stores. Consuming applications must identify with the VPD group, to use it. Each VPD request can specify its own degree of parallelism.
A large PS (single flat file) is on disk that the customer doesn’t want to read more than once for operational and performance reasons. Instead, the customer wants to import the content of the file into multiple data stores. Consuming applications must identify with the VPD group, to use it. Each VPD request can specify its own degree of parallelism.
VPD can be used to access multiple sources using various client applications and drivers.
| Supported Data Sources | Supported Client Access |
|---|---|
|
Adabas
IDMS
IMS
VSAM
Logstreams
MQ Series
Sequential
Tape
zFS
|
Batch
DSSPUFI
JDBC
ODBC
IzODA (Spark Scala, Spark Java, Python DB API)
Db2 Query Manager Facility
IDAA Loader
|
Table 2 - Supported Data Sources and client access using VIPA
Considerations and Limits
- If VPD is not used, then each client has to create a separate virtual table to access the same set of data from the source. With VPD, DVM creates one virtual table for accessing the data by all the clients.
- The end-to-end read operation has to be carried out by each client application. With VPD, the data is read from the source once and the same data is consumed by each client application in parallel.
- Input devices like tape can be read-only serially and hence parallelization is not possible. Each of the client applications has to read the data from source to destination serially.
- With VPD, the DVM can read the data from tape serially once whereas the client applications can access the data in parallel from DVM buffers.
- INPUT devices like Tape can be read-only serially and hence parallelization is not possible. Each of the client applications has to read the data from source to destination in serial. With VPD, the DVM can read the data from tape serially once whereas the client applications can access the data in parallel from DVM buffers.
- Client applications that need to read data in a specific order, have to read the data from an original data source in its' specific order. Even when the data can be read from the source in parallel, VPD allows the data to be read into DVM buffers in parallel. Client applications can then read the data from buffers in any specific order.
Workload Management
Workload management is critical to ensure optimal performance across different workloads. Performance goals for various workloads can be defined using the IBM Workload Manager for z/OS (WLM) with the ability to further assign the required importance of each workload in business terms. Resources are assigned to specific work items to determine the ability to attain goals through continuous monitoring where resource adjustments are made to achieve wanted business objectives.
IBM Z resources are assigned based on goals defined in the IBM Workload Manager shown in Figure 4.

Figure 4 - Resource priority assignments by WLM
Business priority can be specified for the WLM services in the DVM Server. Specific service classes are used to inform the operating system of specific performance goals and priority levels shown in Figure 5.
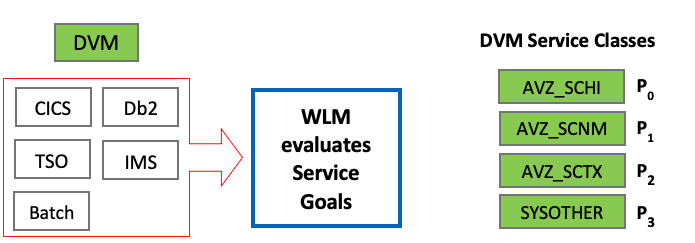
Figure 5 - Resource priority assignments by WLM
In the service class, you assign each goal and its relative importance and associate the service class with a specific workload and resource group. The DVM Server uses the following service classes:
- AVZ_SCHI ZIIPCLASS=AVZ High priority. This service class is for IBM Data Virtualization Manager for z/OS critical work. Assign this class goal as close to SYSSTC as possible.
- AVZ_SCNM ZIIPCLASS=AVZ Normal work. This class is for IBM Data Virtualization Manager for z/OS administrative work. Assign this class the same priorities as those used for DB2 or the IMS control region.
- AVZ_SCTX ZIIPCLASS=AVZ Client work. This service class is for client requests. Assign this class the same goals as those supporting the data source for the CICS, IMS/TM or DB2 WLM address space.
To enable the WLM policy for the DVM Server, the DVM user ID (default: AVZS) can have UPDATE access to MVSADMIN.WLM.POLICY. If the WLM policy is not defined for the DVM server, then WLM assigns the lowest service class SYSOTHER to DVM workloads, which negatively impacts the DVM Server performance.
Configuring WLM for the DVM Server
The Workload Manager policy can be enabled in AVZSIN00 configuration members.
If DoThis then
do
“MODIFY PARM NAME(WLMFORCEPOLICY) VALUE(YES)”
“MODIFY PARM NAME(WLMTRANNAME) VALUE(APPLNAME)”
“MODIFY PARM NAME(WLMUSERID) VALUE(AVZS)”
End
WLM definitions can be set manually, as well: https://www.ibm.com/support/knowledgecenter/en/SS4NKG_1.1.0/havada10/topics/dvs_sg_con_workload_manager.html
Working with multiple DVM servers
To handle more workloads and ensure organizational service level objectives, more DVM servers can be instantiated and the server workload can be balanced across multiple DVM servers. Load balancing allows inbound connections to be automatically directed to the DVM Server instance that has the most available resources for the number of connections. The overall availability of virtual storage (less than or greater than 16 Megabytes reference point) determines which DVM Server instance handles an individual request.
Managing Workload within a single LPAR
Load balancing is transparent to the client application. Client applications use a port number to connect to a DVM Server, which then performs Port sharing to route a request to a more optimal DVM Server as needed. TCP/IP's SHAREPORT or SHAREPORTWLM is the recommended approach to load balance workload across multiple DVM Servers within a single LPAR.
Managing Workload over multiple LPARs, Regions or Sysplex
When balancing workload across a Sysplex, Dynamic Virtual IP Addressing (DVIPA) can be leveraged as it provides workload balancing and failover for applications that use TCP/IP services. With SHAREPORT, SHAREPORTWLM, and DVIPA, all the balancing is done at the TCP/IP layer and the Server is unaware that any balancing is taking place. The load balancing of CICS regions is handled differently in DVM servers using LOADBALGROUP parameter.
Using SHAREPORT and SHAREPORTWLM
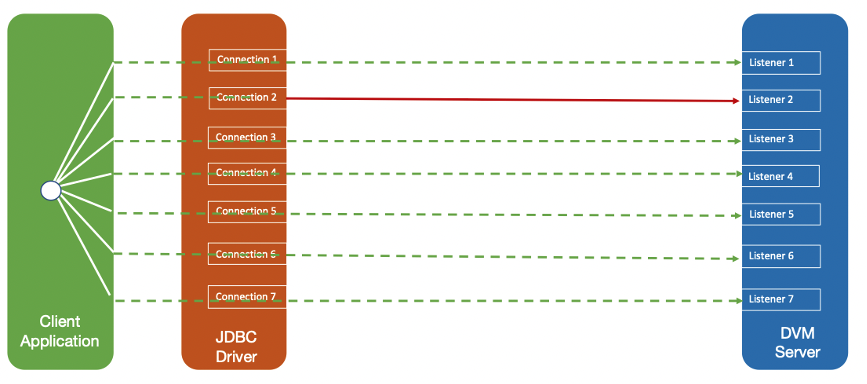
Port sharing is a method to distribute workloads for DVM Servers within a z/OS LPAR. TCP/IP allows multiple listeners to listen on the same combination of port and interface. Workloads destined for this application can be distributed among the group of DVM Servers that listen on the same port. Port sharing does not rely on an active sysplex distributor implementation; it works without a Sysplex distributor. Port sharing can be used in addition to sysplex distributor operations. z/OS currently supports two modes of port sharing - SHAREPORT and SHAREPORTWLM.
SHAREPORT
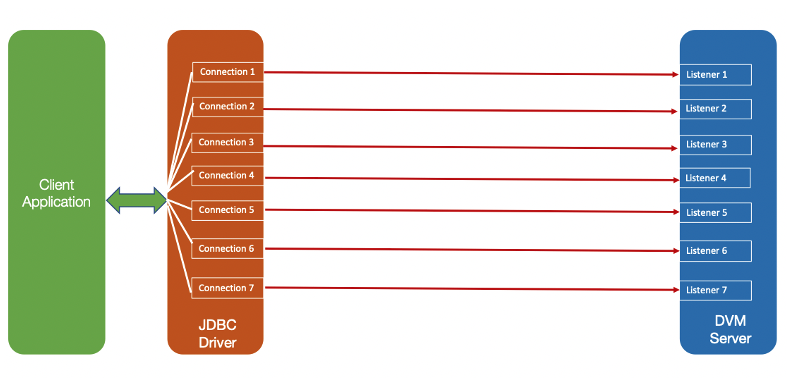
Incoming client connections for a configured port and interface are distributed by the TCP/IP stack across the listeners that use a weighted round-robin distribution method based on the Server accept Efficiency Fractions (SEFs). The SEF is a measure of the efficiency of the server application, calculated at intervals of approximately one minute, in accepting new connection requests and managing its backlog queue shown in Figure 6.
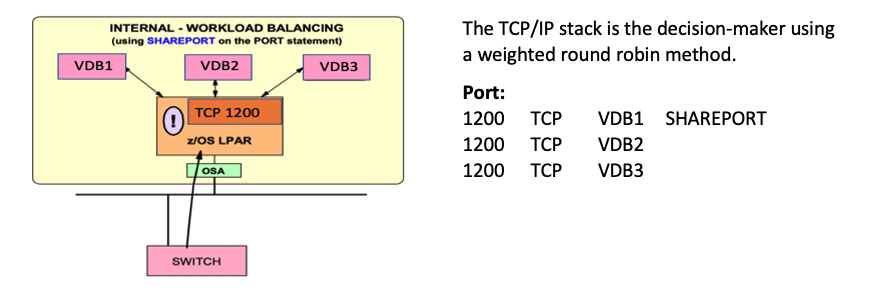
Figure 6 - SHAREPORT configuration
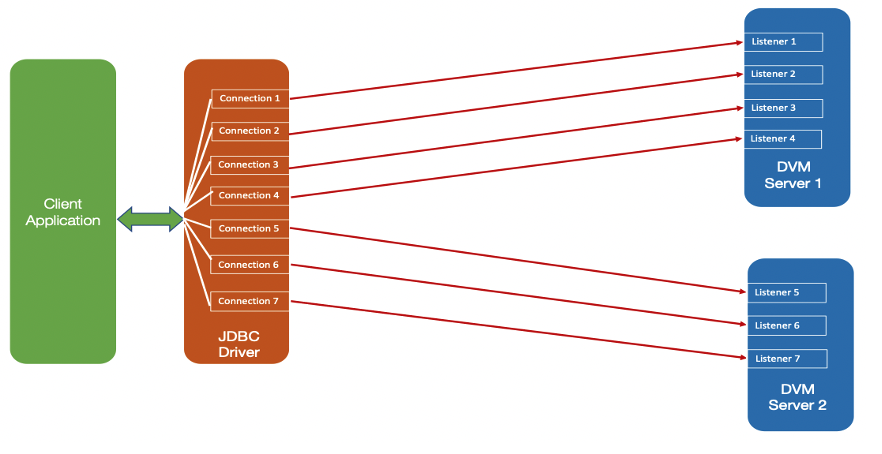
SHAREPORTWLM
You can use the SHAREPORTWLM option instead of SHAREPORT. Similar to SHAREPORT, SHAREPORTWLM causes incoming connections to be distributed among a set of TCP listeners. However, unlike SHAREPORT, the listener selection is based on WLM server-specific recommendations, modified by the SEF values for each listener. These recommendations are acquired at intervals of approximately one minute from WLM, and they reflect the listener’s capacity to handle additional work.
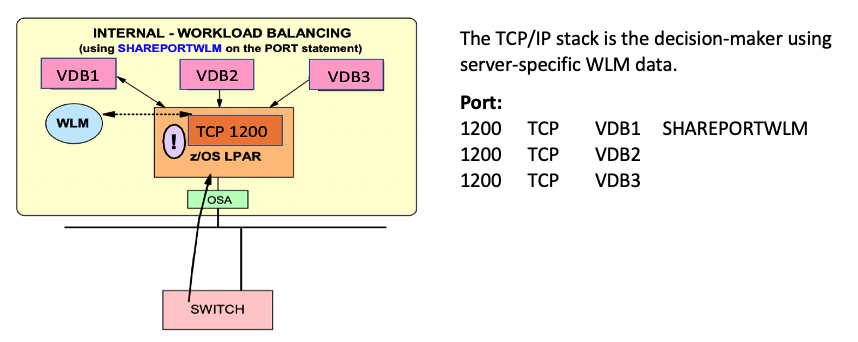
Figure 7 - SHARPORTWLM configuration
WLMHEALTHREPORT, SHAREPORTWLM, and the DVM Server
The DVM Server reports a Health Status to WLM to allow WLM to better manage which DVM Server to pass an inbound connection when using SHAREPORTWLM.
The WLMHEALTHREPORT parameter must be set to YES, which is the default. An informational message is available with the Server WLMHEALTHREPORT support to indicate when the health status of the DVM Server changes.
Example
VDB1DB0724I Server VDB1 WLM health changed from 100% to 90%.
Depending on the severity or frequency of errors, the health setting % can be reduced further and extra messages issued. Once the health of the Server increases an extra message is generated similar to the following.
Example
VDB1DB0724I Server VDB1 WLM health changed from 90% to 100%.
The Server Trace Browse can be used to further investigate abrupt changes in WLM Health Status. No change is required for the DVM Server configuration member AVZSIN00 to support SHAREPORT or SHAREPORTWLM.
Sysplex Load Balancing with DVIPA
The “distributor stack” is a network-connected stack that owns a specific VIPA address and acts as the distributor for connection requests. The target stack is the owner of DVM Server instances, to which the distributing stack forwards the requests. Together, they are called “participating stacks” for the sysplex distributor.
All participating z/OS images communicate through XCF, which permits each TCP/IP stack to have full knowledge of IP addresses and server availability in all stacks. Sysplex “distributor” for z/OS-integrated intra sysplex workload balancing of DVM Servers is depicted in Figure 8.
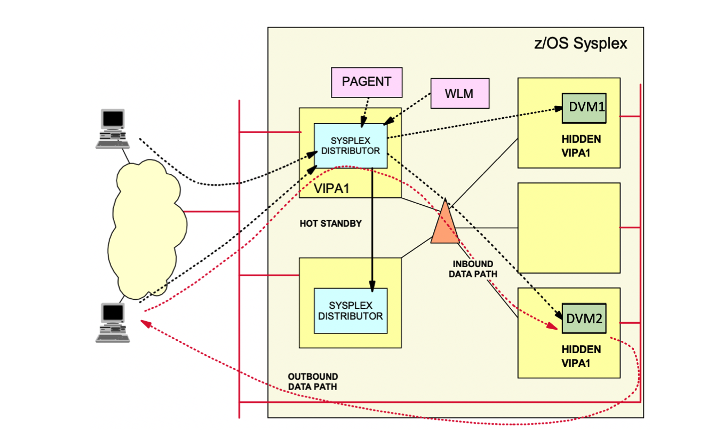
Figure 8 - Sysplex Load balancing using DVIPA
Sysplex “distributor” provides an advisory mechanism that checks the availability of DVM Servers running on separate z/OS images in the same sysplex and then selects the best-suited target server for a new connection request. The Sysplex distributor bases its selections on real-time information from IBM Workload Manager (WLM). Sysplex distributor also measures the responsiveness of target servers in accepting new TCP connection setup requests, favoring those servers accepting new requests.
When the selection of the target stack is complete, the connection information is stored in the sysplex distributor stack to route future IP packets that belong to the same connection as the selected target stack. Routing is based on the connection (or session) to which IP packets belong, which is known as connection-based routing.
Configuring DVIPA and Sysplex Distributor are done within the TCP/IP stack itself and there are no components in DVM server, which need to be configured. Once the Sysplex has been configured to enable dynamic linking, any inbound connections can issue a CALL to WLM to check which is the ideal stack to route the connection to.
Configure DVIPA by using IBM documentation and define a VIPADYNAMIC section in the TCP/IP profile:
VIPADYNAMIC
VIPADEFINE 255.255.255.0 10.17.100.60
VIPADISTRIBUTE
DISTMETHOD BASEWLM 10.17.100.60
PORT 2200
DESTIP
192.168.1.1
192.168.1.2
ENDVIPADYNAMIC
10.17.100.60 is the DVIPA address. The further definition (DISTMETHOD BASEWLM) states to do WLM Distribution of all inbound requests coming into port 2200. Plan on having one DDVIPA address and one non-DDVIPA address for those applications and connections not needing broadcast. To have DVM Server’s TCP/IP listener listen on two IP addresses (one DDVIPA and one non-DDVIPA), the following “extra” parameters need to be set:
IF DoThis then
“MODIFY PARM NAME(ALTERNATEIPADDRESS1) VALUE(10.17.100.60)”
“MODIFY PARM NAME(DVIPABINDALL) VALUE(YES)”
END
It is recommended to use the ALTERNATEIPADDRESS1 as the DDVIPA address. ALTERNATEIPADDRESS2 is another optional parameter that can be used to specify a third IP address.
Load Balancing with CICS regions
The DVM Server manages Load balancing for CICS regions using the LOADBALGROUP parameter in the CICS definition for the CICS server configuration member. Define the following statements in IN00:
“DEFINE CONNECTION NAME(AAAA)”,”GROUP(AAAA)”, “ACCESSMETHOD(IRC)”,”NETNAME(SDBAAAA”, “INSERVICE(YES)”,”PROTOCOL(EXCI)”, “APPLID(CICSJ)”,”LOADBALGROUP(LBG1)” “DEFINE CONNECTION NAME(BBBB)”, “GROUP(BBBB)”,”ACCESSMETHOD(IRC)”, “NETNAME(SDBBBBB)”,”INSERVICE(YES)”, “PROTOCOL(EXCI)”,”APPLID(CICSL)”, “LOADBALGROUP(LBG1)”
This causes DVM Server to decide which CICS region belongs to the same LOADBALGROUP (Either CICSJ or CICSL) to send the request to (usually round-robin). If one CICS belonging to the LOADBALGROUP becomes INACTIVE (For example CICSJ), then the DVM Server sends a new CICS request to the other CICS (CICSL) which is part of the same LOADBALGROUP. There could be many CICS regions for the same LOADBALGROUP.
Db2-Direct and IMS-Direct
The Db2-Direct and IMS-Direct are features provided by the DVM Server to directly access the backend datasets of Db2 for z/OS and IMS by bypassing the respective database managers for improved performance and reduced elapsed time. This feature can be used for READ-ONLY operations, which do not require data integrity of the latest database UPDATE operations similar for analytical queries. Figure 9 illustrates this bypass of the underlying database subsystems for I/O.
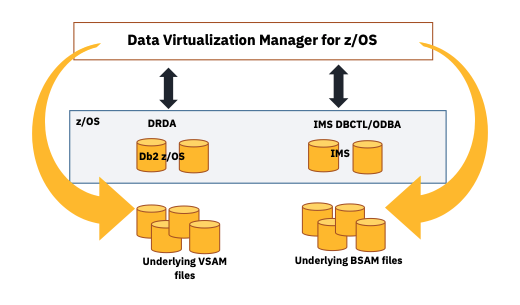
Figure 9 - DVM server bypass of database I/O subsystems
Db2-Direct
Db2-Direct is a DVM Server access method that reads Db2 VSAM linear datasets directly, instead of accessing the data through traditional Db2 APIs. Large data pulls can be performed in service request block (SRB) mode with MapReduce and Virtual Parallel Data features without any prerequisite processing, such as the collection of statistics that use the DVM command DRDARange. Db2-Direct allows READ-ONLY access to the data and it provides a significant benefit in performance and reduced elapsed time in processing analytical queries.
Transactional integrity is not guaranteed due to the absence of record-level locking during reading activity. Security is managed by using Db2 table authorization. If Db2-Direct table security is disabled with the DISABLEDB2DIRSEC parameter in the INOO, unauthorized users by using Db2 APIs can gain access to Db2 data.
Considerations and Limitations:
- Db2-Direct does not support tables with edit procedures or SQL statements containing joins, LOB columns, or key columns.
- The Db2 subsystem hosting a Db2 table must be active when Db2-Direct enabled tables are loaded or refreshed. The MAP building requires Db2 system access to identify data set information in the Db2 system catalog.
- The DVM Server requires READ access to the Db2 VSAM linear datasets and that datasets are available during map load or refresh for the virtual table.
- Virtual tables enabled for Db2-Direct must include all the columns defined in the base Db2 table as the column information is not available while loading directly from DB2 VSAM linear datasets.
- If Db2-Direct table security is enabled, the Db2 subsystem must be available to check security at SQL query time.
- If Db2-Direct security is disabled, the CCSIDs of table columns assumed based on the ENCODING_SCHEME (EBCDIC, Unicode, ASCII) of the table.
- Users can check the DVM server trace logs for the following messages to confirm whether DB2-Direct is enabled or used.
Startup: DB2 direct processing enabled for <map-name>
Running: Processing table that uses DB2 direct
Failure: DB2 direct processing disabled for <map-name>
Hierarchical direct access method (HDAM) – VSAM and OSAM Hierarchical indexed direct access method (HIDAM) – VSAM and OSAM Partitioned HDAM (PHDAM) – VSAM and OSAM Partitioned HIDAM (PHIDAM) – VSAM and OSAM Fast Path data entry database (DEDB)
When the driver logs on to the server, it requests for the MaximumBufferSize. If the MaximumBufferSize is greater than NETWORKBUFFERSIZE, then the server tells the driver to use the NETWORKBUFFERSIZE in the logon response. Setting the MaximumBufferSize value, consider the distance between the client and the server as network latency can harm performance. The buffer size that works best for clients and servers that are closer in proximity (low latency) need not be the buffer size that works best when clients and servers are not near (high latency). Figure 10 illustrates how an INSERT statement is sent using multiple buffers to the DVM server.
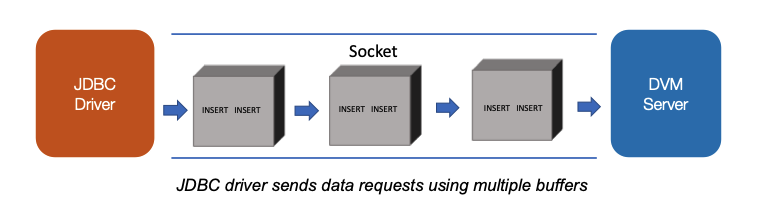
Figure 10 - JDBC driver sending multiple buffers for INSERT
When you execute a large SQL INSERT statement or a batch of INSERT statements, the statements are divided into multiple data buffers of buffer size negotiated with the DVM server. The buffers are then sent to the server. Figure 11 shows the server sending the client rows of data in a single buffer:
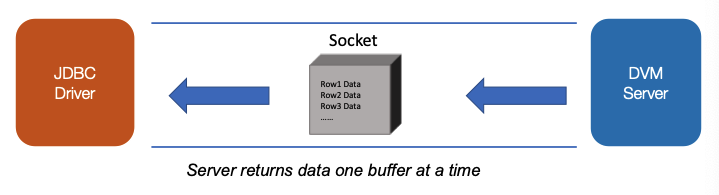
ResultSet rs = stmt.executeQuery(“SELECT a, b, c FROM Table1”);
while (rs.next())
{
String s = rs.getString(“b”);
loat f = rs.getFloat(“c”);
}
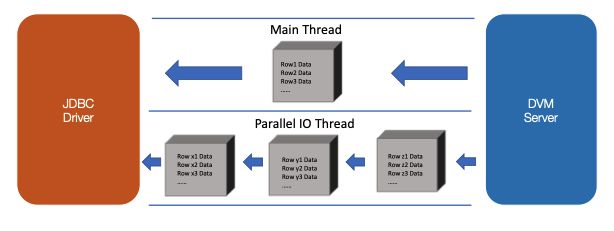
Figure 12. Parallel IO pre-fetches buffers
Server-controlled MapReduce – MapReduce is performed on the server using the JDBC driver. Client-controlled MapReduce – MapReduce is performed on the client and the JDBC driver manages single connections, whereas the client manages other connections and aggregate the results from each connection.
The MapReduceClientCount property is used to specify the total number of connections associated with the group of client connections. The MapReduceClientNumber property defines a specific client connection within the group is managed by the JDBC driver and has a value between the number 1 and the number specified for the MapReduceClientCount property. The JDBC driver executes queries using the single MapReduce connection for the client connection specified in the MapReduceClientNumber property. Ddata for the specified connection are returned, as opposed to using MapReduceClientCount over one or more connections to get all rows of data. To configure client-side MapReduce, set the JDBC driver MapReduceClientNumber and MapReduceClientCount parameters as follows:
Example
MapReduceClientNumber, MapReduceClientCount
MapReduceClientNumber=2; MapReduceClientCount=7;
Though increasing resources is an easy option, it is worthwhile to invest time into writing efficient SQL statements for the DVM server to consume. The DVM server is an SQL engine working over 35+ different legacy data sources, which don't conform to relational database rules. A best practice is to conform to the most compliant SQL that matches the source data system. This includes not only SQL, but also functions, routines, and data type.
Select only the required fields Understand how a Large and Small table is being JOINED Avoid scalar, arithmetic process into the SQL’s
Simple predicate rewrites cause the optimizer to generate significantly different query plans and force a different access path, which result in getting the best out of the SQL Avoid tablespace scans when your goal is to fetch a much smaller subset of data Sort only on the columns needed Minimize the number of times cursors are opened and closed
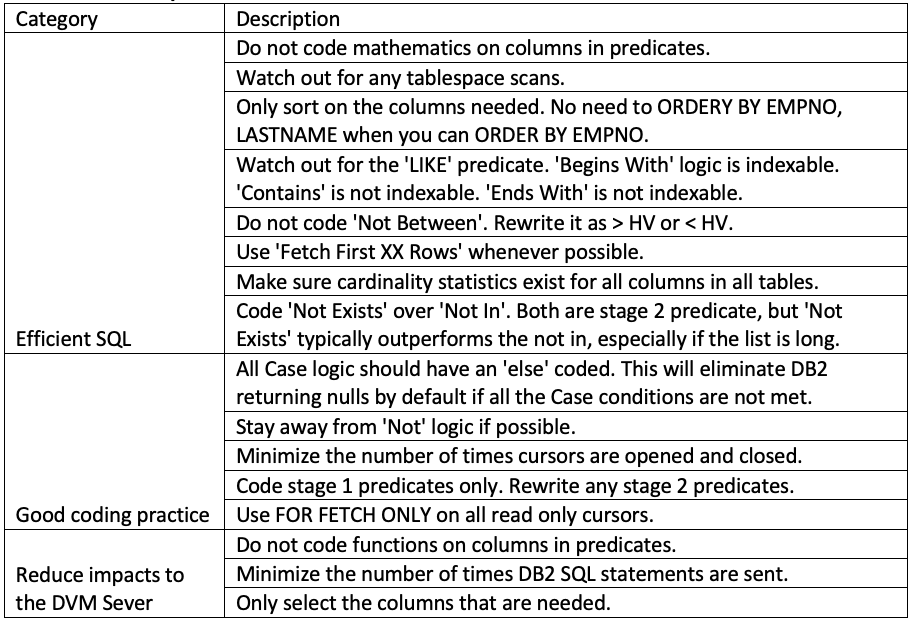
Table 3 - Best practices for query design

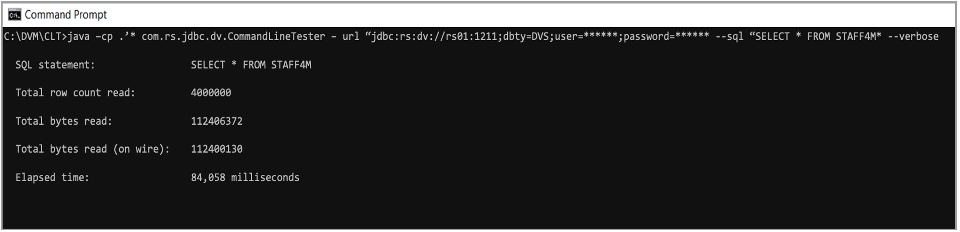
No limit on the number of rows processed Reports summarized execution time for data transfer Isolates performance issues from application requesters Uses ANSI SQL Flexible OUTPUT options Command line driven Validated through a RESTful API
[{"Type":"SW","Line of Business":{"code":"LOB10","label":"Data and AI"},"Business Unit":{"code":"BU059","label":"IBM Software w\/o TPS"},"Product":{"code":"SS4NKG","label":"IBM Data Virtualization Manager for z\/OS"},"ARM Category":[{"code":"a8m0z000000cxAOAAY","label":"SQL Engine"}],"Platform":[{"code":"PF035","label":"z\/OS"}],"Version":"All Version(s)"}]
Product Synonym
DVM
Was this topic helpful?
Document Information
Modified date:
01 September 2021
UID
ibm16452637