White Papers
Abstract
Prometheus, Grafana and Alertmanager is the default platform monitoring stack in Redhat Openshift/IBM Cloud Pak for Data (CP4D). This white paper presents a case study on how to use this stack to monitor both infrastructure and application components which is a crucial Day 2 operation to ensure system availability and performance. The use case 1 focuses on Portworx Storage and use case 2 describes monitoring/alerting on etcd cluster which is a critical metadata store in many CP4D applications.
Content
Monitoring OpenShift in IBM Cloud Pak for Data
Abdul Hafeez, Chengmin Ding, David Sagal
IBM Corporation, Herndon VA
Table of Contents
A Closer Look At Prometheus, Grafana and Alertmanager
Prometheus and ServiceMonitors
Example Use Case 1: Portworx Storage Monitoring
A Customized Portworx Volume Dashboard in Grafana
Testing Alertmanager with Dbench
Example Use Case 2: etcd Monitoring
Testing etcd Alerts with Dbench/FIO
List of Figures
Figure 1: A representation of the architecture of IBM Cloud Pak for Data
Figure 2: A representation of the architecture of RedHat OpenShift
Figure 3: A representation of the architecture of Prometheus
Figure 3.1: A representation of the Prometheus Operator’s interaction with ServiceMonitors
Figure 3.2: The Service object which needs to be monitored
Figure 3.3: The ServiceMonitor for the Service in Figure 3.2
Figure 4: An example of a Grafana dashboard containing several different types of panels
Figure 5: An example of an alert rule
Figure 6.1: A ServiceMonitor for Portworx
Figure 6.2: The Portworx service corresponding to the ServiceMonitor in figure 6.1
Figure 7: Portworx metrics shown in the Prometheus UI
Figure 8.1: Navigating to the create->import option in the Grafana UI
Figure 8.2: Pasting in the contents of a JSON configuration file
Figure 8.3: Selecting Prometheus as the data source for a dashboard
Figure 8.4: A newly created dashboard visible in the list of dashboards
Figure 8.5: Reaching the "save as" button through the settings menu
Figure 8.6: Naming our new copy of the Portworx Volume Dashboard
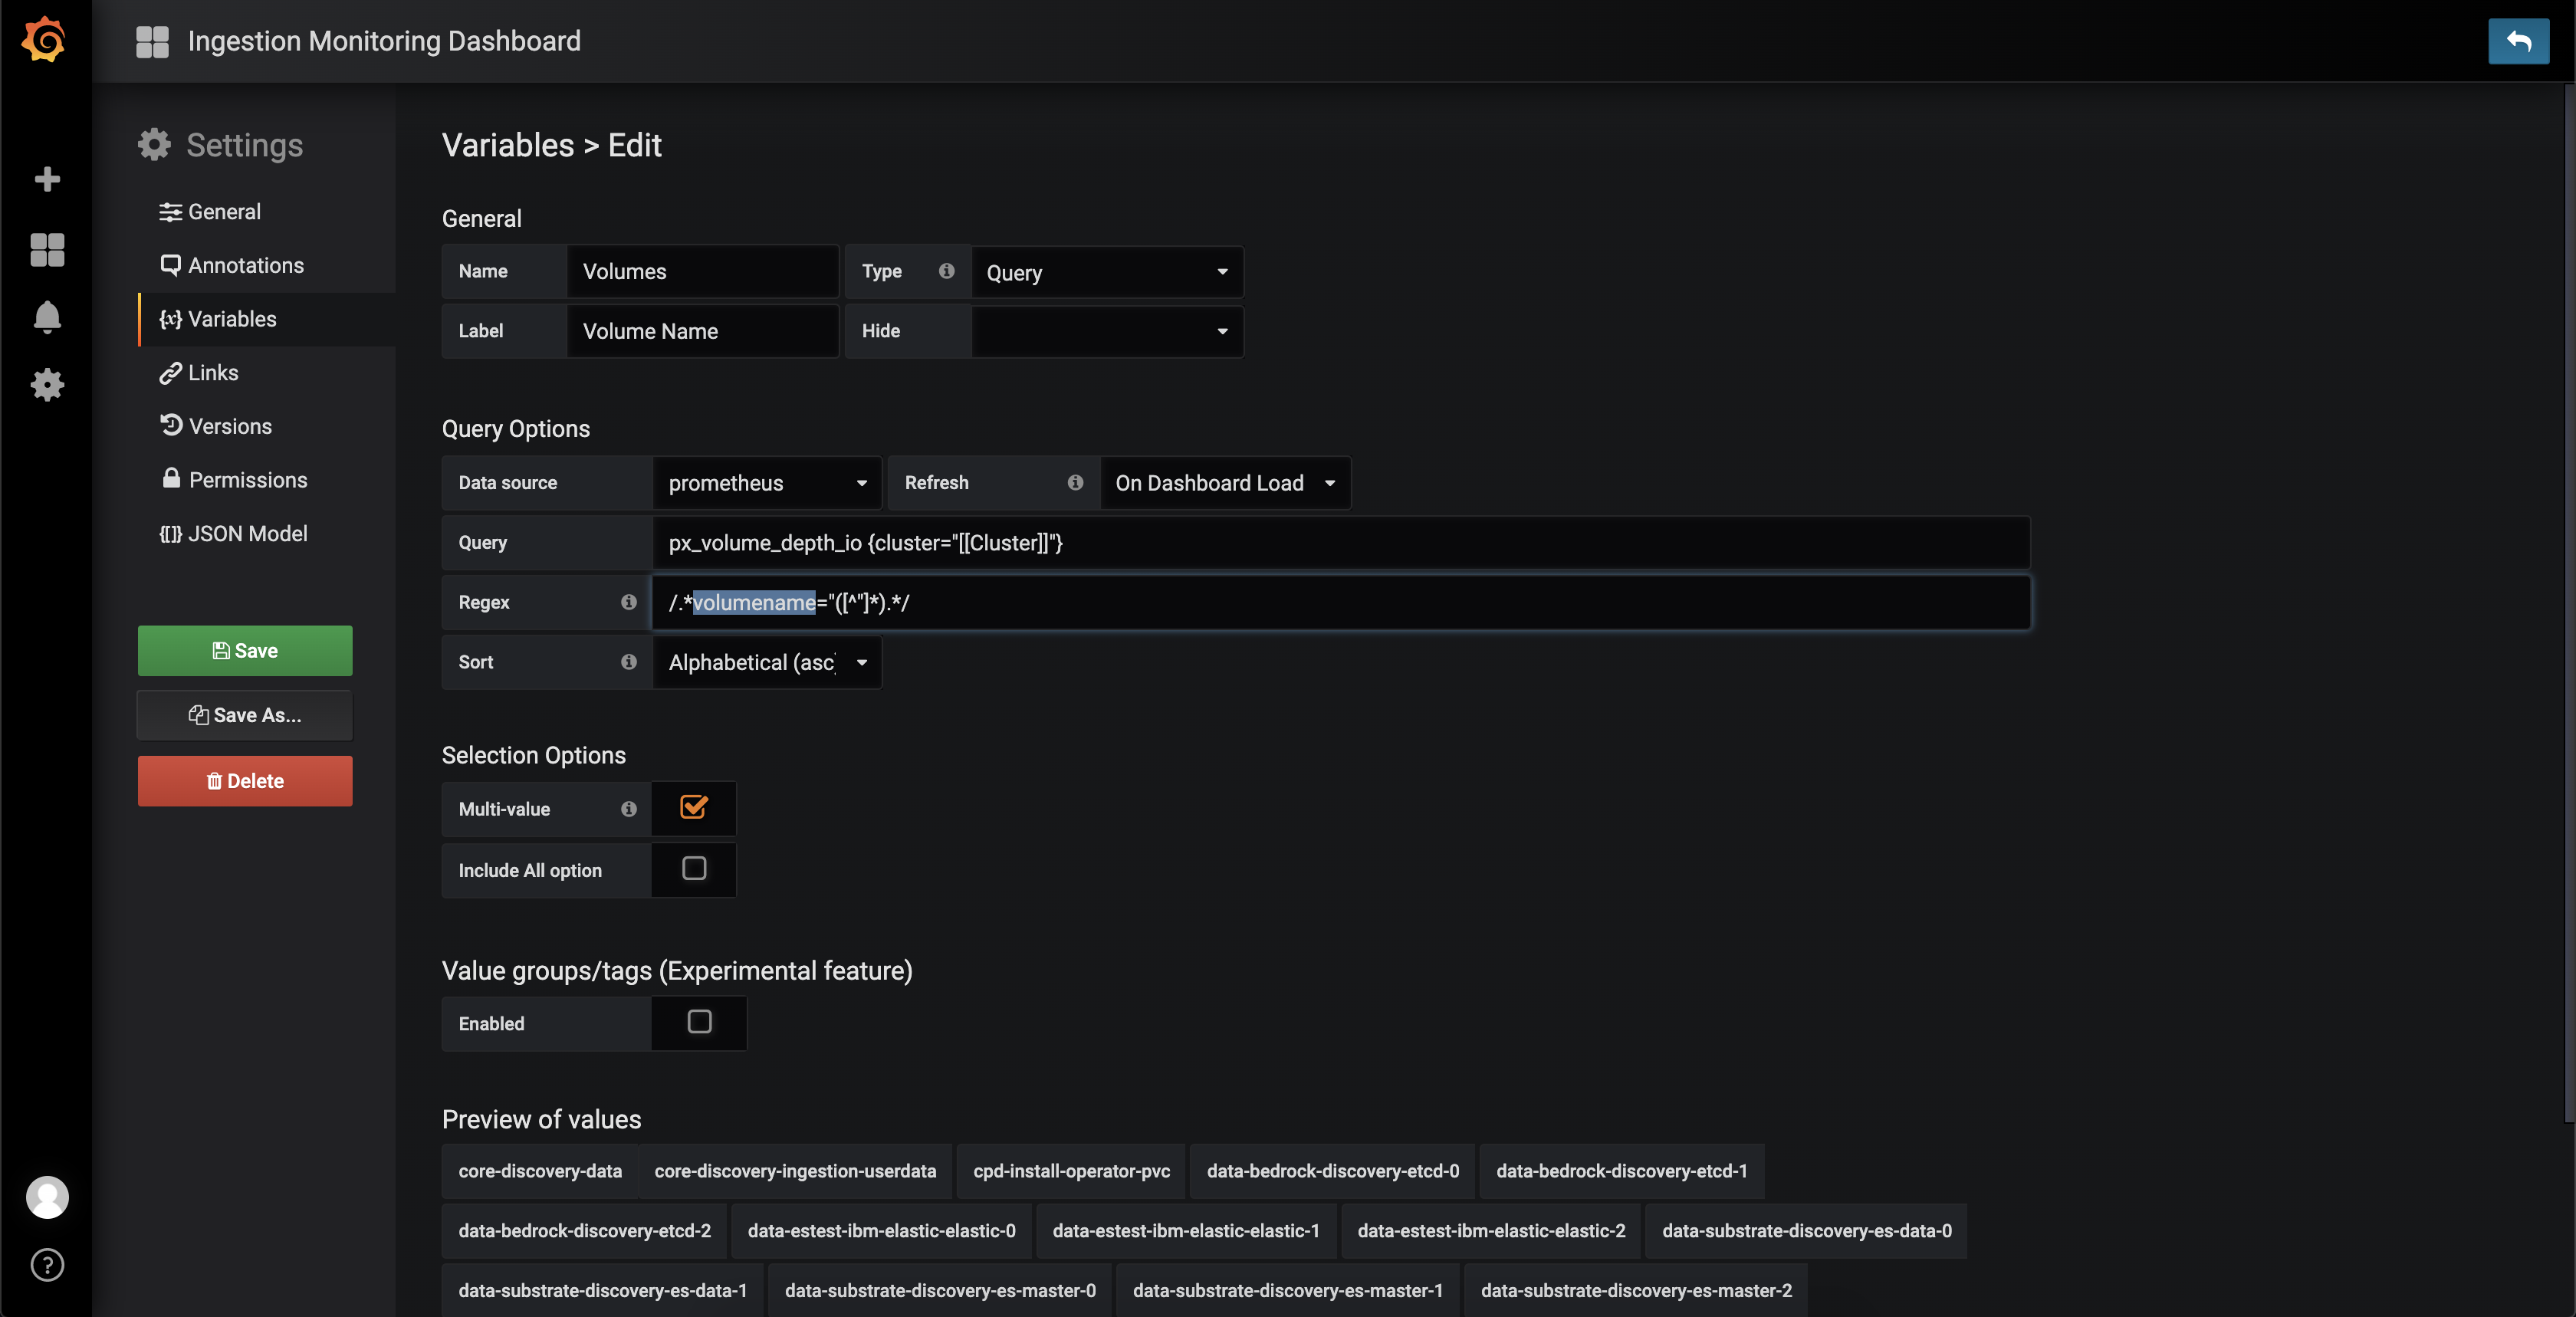
Figure 8.7: Accessing the "Volumes" variable in order to edit it
Figure 8.8: The newly edited regular expression and the result of the change
Figure 8.9: Our new variable label in our dashboard
Figure 8.10: Creating a new row
Figure 8.11: A newly created row
Figure 8.12: Copying a panel
Figure 8.13: Using the paste option to paste a panel
Figure 8.14: Result after moving a panel into a row
Figure 8.15: The menu used for editing a panel
Figure 8.16: The working panel after modifying the PromQL expression
Figure 8.17: Selecting the repeat option for each value of the "Volumes" variable
Figure 8.18: Our panel's title after having the "Volumes" variable's value added to it
Figure 8.19: The new dashboard with only 1 PVC name selected
Figure 8.20: The new dashboard with 3 PVC names selected
Figure 9: Portworx alert rules shown in the Prometheus UI
Figure 9.1: Retrieving the Slack Incoming Webhook URL
Figure 10.1: The dbench-pv-claim pvc and dbench job being created
Figure 10.2: A newly created pvc and its associated volume name
Figure 10.3: The volume selected in the dropdown menu and its activity its volume usage
Figure 10.4: A firing alert in slack
Figure 11.1: A new instance of etcd being shown in Prometheus after our ServiceMonitor is installed
Figure 11.2: The script used to install FIO being run
Figure 11.3: Four screen windows are created
Figure 11.4: The metric being shown in Prometheus has surpassed a value of 8 which should trigger our example alert
Figure 11.5: Our example etcd alert firing in Slack
Configuration File 1: A YAML file used to configure a ServiceMonitor to monitor Portworx
Configuration File 2: A YAML file used to create rules for Prometheus to use in order to alert
Configuration File 3: A YAML file used to configure Alertmanager to send alerts to Slack
Configuration File 4: A YAML file used to apply an alert rule for testing Alertmanager
Configuration File 6: A YAML file used to create a ServiceMonitor for an external etcd cluster
Configuration File 7: A YAML file used to create an example alert rule for our etcd alert demo
Introduction
IBM Cloud Pak for Data (CP4D) is the new Data & AI middleware that provides a comprehensive set of preintegrated software for big data integration and analytics needs. It is an open platform that can have additional addons or custom applications to be deployed on top of it.
It is a complicated system and has many layers as seen in figure 1. In order to support smooth daily operations of the platform or quickly identify the root cause of a problem, it is important to monitor and collect information from different layers as it is very difficult to determine the cause of an issue if there is not much context available. For example, in cases where strange behavior is occurring in certain applications, if metrics are only being collected at the cartridge (or addon) level, the only thing that is known for sure is that there is issue occurring at application UI and difficult to identify the real problem. If metrics are collected at the control plane level, such as from RedHat OpenShift, there can be much more information uncovered about the root cause of the problem.

Figure 1 - A representation of the architecture of IBM Cloud Pak for Data
From a monitoring perspective, we can focus on the OpenShift layer that supports CP4D. In figure 2, we can see that there are more sublayers within the OpenShift layer.

Figure 2 - A representation of the architecture of RedHat OpenShift
To create an effective monitoring system, we can use the three components recommended in the official OpenShift monitoring documentation [12].
- We will need to collect and store metrics from the components that we want to watch. To do this, we will use Prometheus.
- We will then need to visualize the data we’ve collected from our system using dashboards we create with Grafana.
- We’ll also need our monitoring system to send us alerts when there is a critical issue. We can create alerts with Alertmanager
A Closer Look at Prometheus, Grafana and Alertmanager
Prometheus is a systems monitoring tool that we can use to collect and store metrics, which can then be used with tools like Alertmanager (which is part of the Prometheus ecosystem) and Grafana. These metrics are stored as time-series data. The Prometheus ecosystem consists of many different parts which are shown in figure 3. Some key components of this ecosystem that we can leverage are:
- The Prometheus server which collects (by pulling) and stores data.
- An alert system which creates rules based on Prometheus metrics and pushes alerts to the Alertmanager
- PromQL, a query language which can be used to create specific expressions that can be used by dashboarding solutions like Grafana

Figure 3 - A representation of the architecture of Prometheus
A ServiceMonitor is a Kubernetes custom resource definition that monitors different services in the environment and is watched by the Prometheus Operator. This means that through a ServiceMonitor, we can monitor a variety of different applications.

Figure 3.1 - A representation of the Prometheus Operators's interaction with ServiceMonitors
To correctly configure a ServiceMonitor to work with the service it monitors, there are a few things that need to be taken into account.


Figure 3.2 - The Service object which needs to be monitored Figure 3.3 - The ServiceMonitor for "example-app"
The ServiceMonitor will use its label selector to determine which service objects to monitor. In our example, the service object in figure 3.2 has the label, “app: example-app”. To match that in the corresponding ServiceMonitor in figure 3.3, under the label selector, we must add the same label, “app: example-app”.
Grafana is a visualization and analytics software. It can take data from a time series database (such as Prometheus), and create elegant dashboards made up of panels. Panels are based on queries. There are many different types of panels, and each of them are suited better for different types of data. These types include graphs, tables, stats, gauges, bar gauges, logs, singlestat and heatmap. There are many premade dashboards available on Grafana’s website which can simply be imported. Panels and dashboards can also be defined using JSON files or directly entering expressions into each panel.
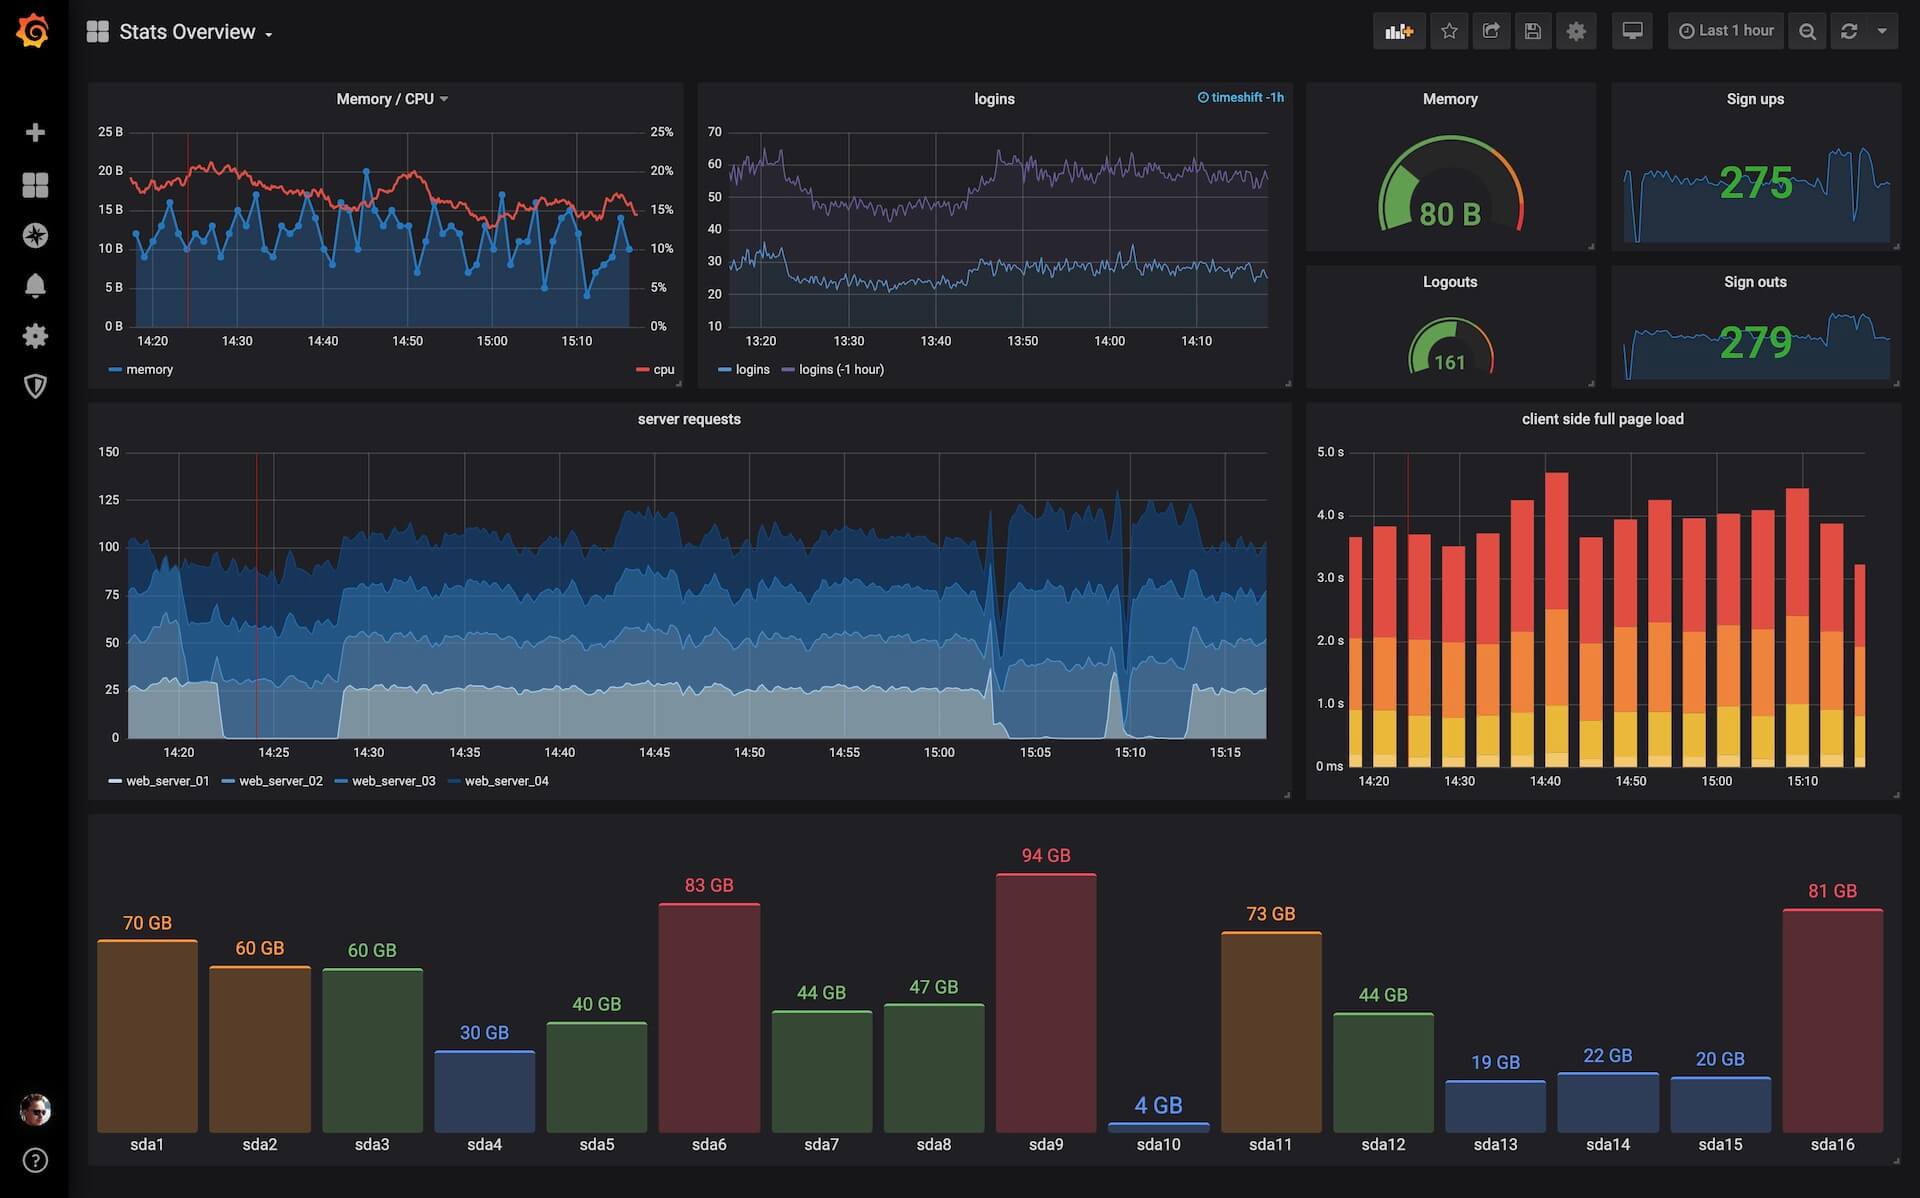
Figure 4 - An example of a Grafana dashboard containing several different types of panels
Alertmanager is a tool that manages alerts sent by applications like Prometheus. Its main features include grouping, silencing and inhibitions. It can group alerts based on certain properties they have. For example, if there is a case where hundreds of services fail, instead of getting hundreds of separate alert notifications, you’d get one compact notification. Silences can simply mute certain alerts for a period of time. If an alert meets the specifications of an active silence, it will not be sent. Inhibitions are a way of stopping certain alerts from firing when there are certain other alerts firing. For example, if there is an alert that is triggered by a cluster not being reachable, then all other alerts from that cluster will be muted because we already know that the cluster cannot be reached along with anything it contains. Alert rules’ expressions are the rules that are evaluated to determine the need for an alert. These are defined in our Prometheus instance by a YAML file as seen in figure 5.

Figure 5 - An example of an alert rule
A comprehensive list of ports Prometheus uses can be found here although the range for core components is 9090-9094 and for exporters, 9100-9999 can be used.
Example Use Case 1: Portworx Storage Monitoring
Prometheus Setup
The first step to monitoring a service is to allow Prometheus to watch it. To do this, a ServiceMonitor can be created by following the steps below:
apiVersion: monitoring.coreos.com/v1 kind: ServiceMonitor metadata: labels: k8s-app: portworx-prometheus-sm name: portworx-prometheus-sm namespace: openshift-monitoring spec: endpoints: - port: px-api targetPort: 9001 - port: px-kvdb targetPort: 9019 namespaceSelector: matchNames: - kube-system selector: matchLabels: name: portworx Configuration file 1: A .yaml file used to configure a ServiceMonitor to monitor Portworx
oc apply -f service-monitor.yaml Now that the YAML file has been applied, we should see something similar to the ServiceMonitor object in figure 6.1.


Figure 6.1 - Our new Portworx ServiceMonitor. Figure 6.2 – portworx, our corresponding service object
Notice that the label selector specifies the same label as the “portworx” service object, since that it what’s being monitored.
Now Portworx metrics should be visible in the Prometheus UI as seen in figure 7.

Figure 7 - Portworx metrics shown in the Prometheus UI
Grafana Setup
Once the metrics are being collected by Prometheus, we can now use those metrics in Grafana. Regarding dashboards in Grafana, we can either create one based on PromQL expressions, or import one using a JSON file. In this case, JSON configurations of a few different dashboards have already been provided by Portworx [13].


Figure 8.1 – Navigating to the create->import option in the Grafana UI

Figure 8.2 - Pasting in the contents of the JSON configuration file

Figure 8.3 - Select Prometheus as the data source for this dashboard


Figure 8.4 - Our new dashboard highlighted by a red arrow(left) and our dashboard(right).


Alertmanager Setup
In order to get alerts about Portworx, we need Prometheus to use alert rules specific to Portworx. Portworx has already provided a set of useful alerts [14]. To use these alerts, we need a yaml file with alert rule expressions as seen in figure 5.
apiVersion: monitoring.coreos.com/v1 kind: PrometheusRule metadata: labels: prometheus: k8s role: alert-rules name: prometheus-rules namespace: openshift-monitoring spec: groups: - name: portworx.rules rules: - alert: PortworxVolumeUsageCritical annotations: description: Portworx volume {{$labels.volumeid}} on {{$labels.host}} is over 80% used for more than 10 minutes. summary: Portworx volume capacity is at {{$value}}% used. expr: 100 * (px_volume_usage_bytes / px_volume_capacity_bytes) > 80 for: 5m labels: issue: Portworx volume {{$labels.volumeid}} usage on {{$labels.host}} is high. severity: critical - alert: PortworxVolumeUsage annotations: description: Portworx volume {{$labels.volumeid}} on {{$labels.host}} is over 70% used for more than 10 minutes. summary: Portworx volume {{$labels.volumeid}} on {{$labels.host}} is at {{$value}}% used. expr: 100 * (px_volume_usage_bytes / px_volume_capacity_bytes) > 70 for: 5m labels: issue: Portworx volume {{$labels.volumeid}} usage on {{$labels.host}} is critical. severity: warning - alert: PortworxVolumeWillFill annotations: description: Disk volume {{$labels.volumeid}} on {{$labels.host}} is over 70% full and has been predicted to fill within 2 weeks for more than 10 minutes. summary: Portworx volume {{$labels.volumeid}} on {{$labels.host}} is over 70% full and is predicted to fill within 2 weeks. expr: (px_volume_usage_bytes / px_volume_capacity_bytes) > 0.7 and predict_linear(px_cluster_disk_available_bytes[1h], 14 * 86400) < 0 for: 10m labels: issue: Disk volume {{$labels.volumeid}} on {{$labels.host}} is predicted to fill within 2 weeks. severity: warning - alert: PortworxStorageUsageCritical annotations: description: Portworx storage {{$labels.volumeid}} on {{$labels.host}} is over 80% used for more than 10 minutes. summary: Portworx storage capacity is at {{$value}}% used. expr: 100 * (1 - px_cluster_disk_utilized_bytes / px_cluster_disk_total_bytes) < 20 for: 5m labels: issue: Portworx storage {{$labels.volumeid}} usage on {{$labels.host}} is high. severity: critical - alert: PortworxStorageUsage annotations: description: Portworx storage {{$labels.volumeid}} on {{$labels.host}} is over 70% used for more than 10 minutes. summary: Portworx storage {{$labels.volumeid}} on {{$labels.host}} is at {{$value}}% used. expr: 100 * (1 - (px_cluster_disk_utilized_bytes / px_cluster_disk_total_bytes)) < 30 for: 5m labels: issue: Portworx storage {{$labels.volumeid}} usage on {{$labels.host}} is critical. severity: warning - alert: PortworxStorageWillFill annotations: description: Portworx storage {{$labels.volumeid}} on {{$labels.host}} is over 70% full and has been predicted to fill within 2 weeks for more than 10 minutes. summary: Portworx storage {{$labels.volumeid}} on {{$labels.host}} is over 70% full and is predicted to fill within 2 weeks. expr: (100 * (1 - (px_cluster_disk_utilized_bytes / px_cluster_disk_total_bytes))) < 30 and predict_linear(px_cluster_disk_available_bytes[1h], 14 * 86400) < 0 for: 10m labels: issue: Portworx storage {{$labels.volumeid}} on {{$labels.host}} is predicted to fill within 2 weeks. severity: warning - alert: PortworxStorageNodeDown annotations: description: Portworx Storage Node has been offline for more than 5 minutes. summary: Portworx Storage Node is Offline. expr: max(px_cluster_status_nodes_storage_down) > 0 for: 5m labels: issue: Portworx Storage Node is Offline. severity: critical - alert: PortworxQuorumUnhealthy annotations: description: Portworx cluster Quorum Unhealthy for more than 5 minutes. summary: Portworx Quorum Unhealthy. expr: max(px_cluster_status_cluster_quorum) > 1 for: 5m labels: issue: Portworx Quorum Unhealthy. severity: critical - alert: PortworxMemberDown annotations: description: Portworx cluster member(s) has(have) been down for more than 5 minutes. summary: Portworx cluster member(s) is(are) down. expr: (max(px_cluster_status_cluster_size) - count(px_cluster_status_cluster_size)) > 0 for: 5m labels: issue: Portworx cluster member(s) is(are) down. severity: critical Configuration File 2: A .yaml file used to create rules for Prometheus to use in order to alert
oc apply -f prometheus-rules.yaml
Under the “alerts” tab in the Prometheus UI, we can see our newly applied Portworx alert rules.

Figure 9 – Portworx alert rules shown in the Prometheus UI

Figure 9.1 - Retrieving the Slack Incoming Webhook URL
global: http_config: proxy_url: <proxy_server_url> route: group_by: ['alertname'] group_wait: 10s group_interval: 10s receiver: 'slack-notifications' receivers: - name: 'slack-notifications' slack_configs: - api_url: <slack_incoming_webhook_url> username: 'Alertmanager' channel: <slack_channel_name> send_resolved: true title: |- [{{ .Status | toUpper }}{{ if eq .Status "firing" }}:{{ .Alerts.Firing | len }}{{ end }}] {{ .CommonLabels.alertname }} for {{ .CommonLabels.job }} {{- if gt (len .CommonLabels) (len .GroupLabels) -}} {{" "}}( {{- with .CommonLabels.Remove .GroupLabels.Names }} {{- range $index, $label := .SortedPairs -}} {{ if $index }}, {{ end }} {{- $label.Name }}="{{ $label.Value -}}" {{- end }} {{- end -}} ) {{- end }} text: >- {{ with index .Alerts 0 -}} :chart_with_upwards_trend: *<{{ .GeneratorURL }}|Graph>* {{- if .Annotations.runbook }} :notebook: *<{{ .Annotations.runbook }}|Runbook>*{{ end }} Configuration File 3 – a .yaml file used to configure Alertmanager to send alerts to Slack (the proxy server field may not be needed for some clusters).
Once that’s been entered, the new configuration can be applied with the following command:
oc -n openshift-monitoring create secret generic alertmanager-main -–from-file=alertmanager.yaml –-dry-run -o=yaml | oc -n openshift-monitoring replace secret –filename=- apiVersion: monitoring.coreos.com/v1 kind: PrometheusRule metadata: labels: prometheus: k8s role: alert-rules name: example-rule.yaml namespace: openshift-monitoring spec: groups: - name: portworx.rules rules: - alert: ExamplePortworxVolumeUsage annotations: description: Portworx volume {{$labels.volumeid}} on {{$labels.host}} is over 70% used for more than 2 seconds. summary: Portworx volume {{$labels.volumeid}} on {{$labels.host}} is at {{$value}}% used. expr: 100 * (px_volume_usage_bytes / px_volume_capacity_bytes) > 70 for: 2s labels: issue: Portworx volume {{$labels.volumeid}} usage on {{$labels.host}} is critical. severity: warning Configuration File 4: A .yaml file used to apply an alert rule for testing Alertmanager
oc apply -f example-rule.yaml kind: PersistentVolumeClaim apiVersion: v1 metadata: name: dbench-pv-claim spec: storageClassName: <storage_class_name> # storageClassName: gp2 # storageClassName: local-storage # storageClassName: ibmc-block-bronze # storageClassName: ibmc-block-silver # storageClassName: ibmc-block-gold accessModes: - ReadWriteOnce resources: requests: storage: 2Gi --- apiVersion: batch/v1 kind: Job metadata: name: dbench spec: template: spec: containers: - name: dbench image: openebs/fbench:latest imagePullPolicy: Always env: - name: DBENCH_MOUNTPOINT value: /data # - name: DBENCH_QUICK # value: "yes" - name: FIO_SIZE value: 1700M # - name: FIO_OFFSET_INCREMENT # value: 256M # - name: FIO_DIRECT # value: "0" volumeMounts: - name: dbench-pv mountPath: /data restartPolicy: Never volumes: - name: dbench-pv persistentVolumeClaim: claimName: dbench-pv-claim backoffLimit: 4 Configuration File 5: A .yaml file used to create a PVC and dbench job to simulate a volume’s storage capacity being 70% filled
oc apply -f dbench.yaml 
Figure 10.1 – The dbench-pv-claim PVC and dbench job being created

Figure 10.2 - The newly created pvc and its associated volume name, in this case it is “pvc-5ab2ed7f-7066-11ea-90a2-005056bf3d69”.

Figure 10.3 - The new volume selected in the dropdown menu and its activity in the volume usage panel

Figure 10.4 - The firing example/test alert being shown in Slack
Example Use Case 2: etcd Monitoring
Prometheus Setup
Once we've chosen a certain external etcd instance in our cluster we want to monitor, we can create a ServiceMonitor the same way we did for the Portworx Storage use case. This time, we can use this configuration to monitor our external etcd instance:
apiVersion: monitoring.coreos.com/v1 kind: ServiceMonitor metadata: labels: k8s-app: wml-etcd-sm name: wml-etcd-sm namespace: openshift-monitoring spec: endpoints: - port: '2379' targetPort: 2379 namespaceSelector: matchNames: - wsl selector: matchLabels: app: wml-etcd 
apiVersion: monitoring.coreos.com/v1 kind: PrometheusRule metadata: labels: prometheus: k8s role: alert-rules name: example-etcd-rule namespace: openshift-monitoring spec: groups: - name: etcd rules: - alert: Example_etcdHighFsyncDuration annotations: message: '[example]etcd cluster "{{ $labels.job }}": 99th percentile fync durations are {{ $value }}s on etcd instance {{ $labels.instance }}.' expr: histogram_quantile(0.99, rate(etcd_disk_wal_fsync_duration_seconds_bucket[5m])) > 8 for: 1s labels: severity: warning apiVersion: v1 kind: Pod metadata: name: wisc-dbench spec: containers: - name: dbench image: openebs/fbench:latest command: ["/bin/sh"] args: ["-c", "while true; do echo hello; sleep 10;done"] #args: ["-l"] imagePullPolicy: IfNotPresent securityContext: runAsUser: 0 env: - name: DBENCH_MOUNTPOINT value: /data # - name: DBENCH_QUICK # value: "yes" - name: FIO_SIZE value: 1M # - name: FIO_OFFSET_INCREMENT # value: 256M # - name: FIO_DIRECT # value: "0" volumeMounts: - name: dbench-pv mountPath: /data restartPolicy: Always volumes: - name: dbench-pv persistentVolumeClaim: claimName: etcd-pvc #! /bin/sh apk --no-cache add \ make \ alpine-sdk \ zlib-dev \ libaio-dev \ linux-headers \ coreutils \ libaio && \ git clone https://github.com/axboe/fio && \ cd fio && \ ./configure && \ make -j`nproc` && \ make install && \ cd .. && \ rm -rf fio && \ apk --no-cache del \ make \ alpine-sdk \ zlib-dev \ libaio-dev \ linux-headers \ coreutils 
apk add screen 
fio --rw=write --ioengine=sync --fdatasync=1 --directory=test-data --size=220000m --bs=23000000 --name=mytest 

Was this topic helpful?
Document Information
Modified date:
12 August 2021
UID
ibm16174375