Troubleshooting
Problem
The graph data in health metrics from the QRadar Deployment Intelligence (QDI) app like "License and Event Rate" and "License and Flow Rate" is not displayed. This issue can be caused by changes to Customs Event Property (CEP) regular expressions, duplicate properties with the same name, or if the properties associated to the Health Metrics Log Source Type in QRadar are disabled. All of these issues can be a cause to why graph data does not display as expected.
Symptom
Although event and flow are displayed in Log activity and Network Activity tabs, QID widgets, such as License and Event Rate, License and Flow Rate, or Top 5 Hosts widgets do not display graph data in Dashboard of the QDI application.
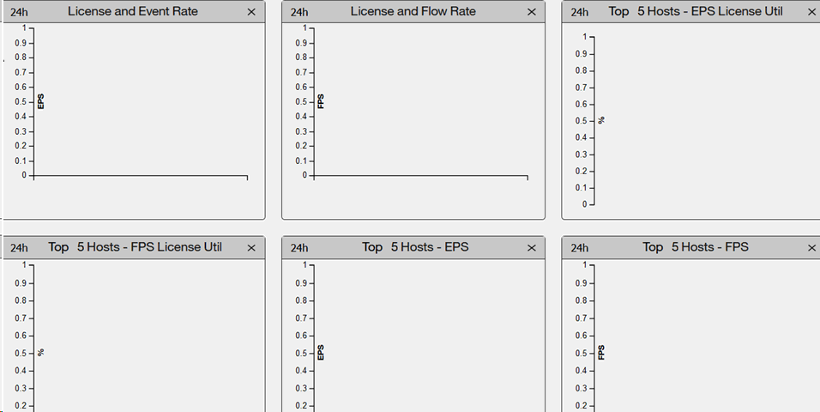
Figured 1: Graph data is not displayed from managed hosts.
Log InLog in to view more of this document
Was this topic helpful?
Document Information
Modified date:
15 March 2021
UID
ibm10743989