White Papers
Abstract
The IBM Z Open Debug Quick Start Guide provides comprehensive instructions for setting up and using IBM z/OS Debugger v5.x in Visual Studio Code for debugging mainframe applications written in COBOL, PL/I, and Assembler. The guide covers the complete setup process including installing the IBM Z Open Debug extension and Zowe Explorer, configuring Zowe z/OS Debug connection profiles with the Debug Profile Service (DPS) and Remote Debug Service (RDS) ports, and setting up VS Code's launch.json file for both "launch" (parking) and "attach" requests. It details how to debug both CICS transactions (by creating and activating debug profiles, parking transactions, and attaching to parked sessions) and batch programs (using either launcher methods or JCL with TEST runtime options), emphasizing the importance of compiling programs with the DEBUG/TEST option to enable source-level debugging. The guide includes optional SSL configuration, authentication methods (basic and token-based with MFA support), and troubleshooting tips, with particular attention to the critical differences in parameter ordering between COBOL and other languages when passing TEST options in JCL.
Content
 IBM Z Open Debug Quick Start Guide
Author: Nelson Lopez, IBM DevOps acceleration Team (2026)
Contents
Step 1: Install IBM Z Open Debug Extension
Step 2: Configure Zowe z/OS Debug Connection Profile
Step 3: Optional - Disable SSL Connection
Step 4: Configure VS Code launch.json
Step 5: Prepare Programs for Debugging Using DBB v3
Method 1: Launch Configuration (Recommended)
Attach to the Parked Batch Session
Overview
IBM z/OS Debugger is a set of z/OS host components that provide application debugging capabilities through various interfaces including traditional 3270 terminals, Eclipse/IDE integration via IBM Developer for z/OS, and Visual Studio Code support through IBM Z Open Debug.
IBM Z Open Debug v5.x allows for running the z/OS Debugger remotely. It is a modern debugging tool that provides advanced capabilities for debugging mainframe applications directly from VS Code. It supports:
- Multiple Languages: COBOL, PL/I, and High Level Assembler programs
- Remote Debugging: Applications running on remote z/OS LPARs
- Multiple Environments: CICS transactions, IMS applications, and batch jobs
- Advanced Features: Conditional breakpoints, step execution, variable inspection & modification
- Secure Authentication: RACF/SAF integration with optional MFA support
Key Resources:
Prerequisites
Before starting, ensure you have:
VS Code Environment
- Visual Studio Code installed on your workstation
- IBM Z Open Debug extension (v5.2.0 or later) from VS Code Marketplace
- Zowe Explorer (automatically installed with Z Open Debug, or reuse existing installation)
- IBM Z Open Editor (highly recommended for COBOL, PL/I, HLASM language support)
z/OS Host Requirements
- z/OS Debugger host components installed and configured
- Access to debugging services:
- Debug Profile Service (DPS) – EQAPROF profile service - manages debug application profiles via REST APIs
- Remote Debug Service (RDS) – EQARMTD remote client connection services - proxy between Debug Engine and Debug Adapter Protocol (DAP) clients, like the VS Code extensions
- Network connectivity from your desktop to the z/OS host
- Valid RACF/SAF credentials with appropriate permissions
Application Requirements
- Programs compiled with debug options enabled (e.g., TEST compiler option for COBOL)
- For CICS: Load libraries defined in the CICS region's RPL DD
- For Batch: JCL with appropriate debug runtime options
Security Configuration
- SSL certificates imported into your OS certificate store (for secure connections)
- Or SSL disabled in Debug Profile Service and Remote Debug Service configuration files (demo/test environments only)
Step 1: Install IBM Z Open Debug Extension
- Open VS Code Extensions view (Ctrl+Shift+X / Cmd+Shift+X)
- Search for "IBM Z Open Debug"
- Click Install
Installation Options
- VS Code Marketplace: Installs Z Open Debug with Zowe Explorer automatically
- IBM Mainframe Download Site: Part of IBM Developer for z/OS bundle (includes Z Open Editor, Zowe CLI, and RSE extensions - officially tested together)
- Note: While Z Open Editor is not required, it's highly recommended because it:
· Provides language support for COBOL, PL/I, and HLASM during debugging
· Enables RSE extensions for Zowe Explorer
Step 2: Configure Zowe z/OS Debug Connection Profile
IBM Z Open Debug uses Zowe connection profiles to access z/OS debugging services.
Obtain Service Port Numbers
Contact your system programmer for the port numbers, or use:
TSOCMD NETSTAT conn | grep EQA
You'll need:
- DPS Port (EQAPROF started task) - typically 8192
- RDS Port (EQARMTD started task) - typically 8193

Note: The NETSTAT command may require special privileges. Consult your system programmer if access is restricted.
Create the Debug Connection Profile
- In Zowe Explorer, locate Z/OS DEBUGGER PROFILES
- a
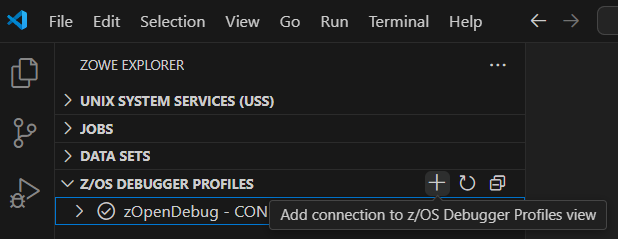
- a
- Click the "+" icon to create a new profile
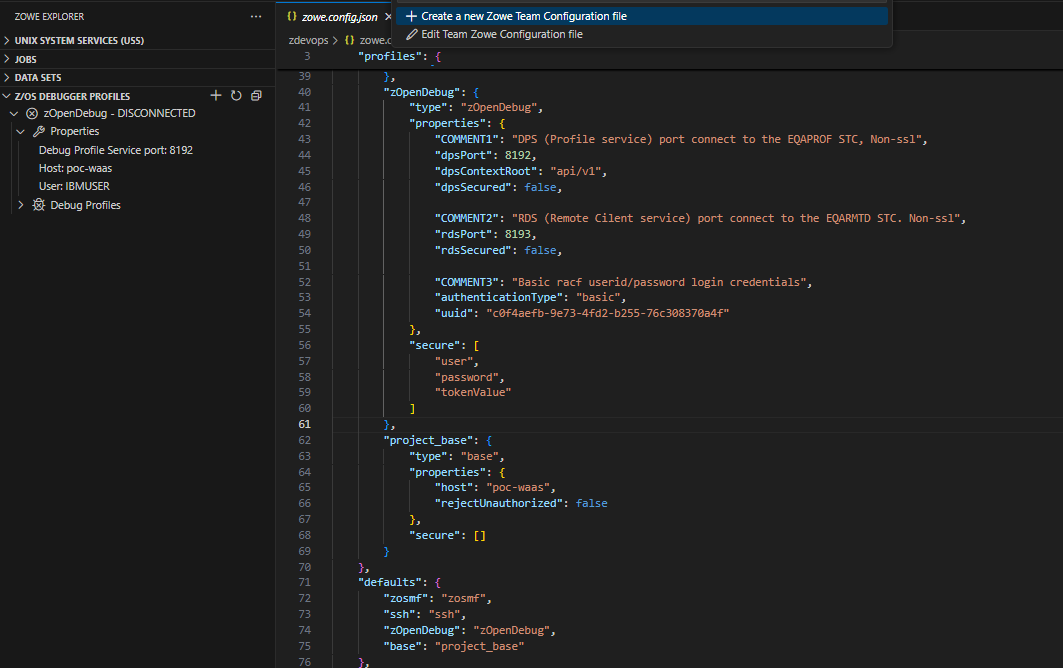
- Enter profile details:
- Profile Name: (e.g., "zOpenDebug")
- Host: Your z/OS system hostname
- DPS Port: Debug Profile Service port
- RDS Port: Remote Debug Service port
- Reject Unauthorized: false (if the host is using self-signed certificates for SSL)
Sample Profile: Available in the Z Open Debug extension help screen.
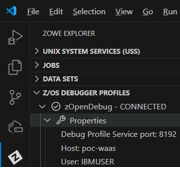
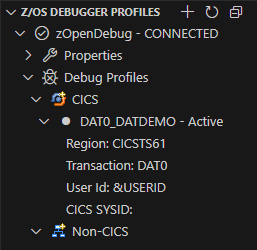
In the example below, the profile, named “zOpenDebug” (left), will connect to the z/OS Debug’s 2 main services – RDS (remote client connection services) and DPS (profile service).
Authenticate to the Debug Connection Profile
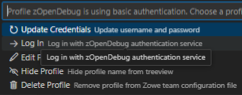
The new connection profile shows as DISCONNECTED by default. Right-click the profile to authenticate:
- Basic Authentication: Select "Add/Update Credentials" to securely store userid/password
- Token Authentication: Select "Log In" to obtain a token from DPS (supports Multi-Factor Authentication (MFA))

Step 3: Optional - Disable SSL Connection
⚠️ For Demo/Test Environments Only
In production, all connections should use SSL (see Enabling Secure Communication documentation). For simplified demo setups, SSL can be disabled:
Configuration Files
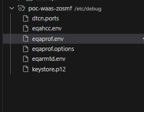
Edit the following files on z/OS (requires Read/Write access):
- /etc/debug/eqaprof.env - DPS configuration
- /etc/debug/eqarmtd.env - RDS configuration
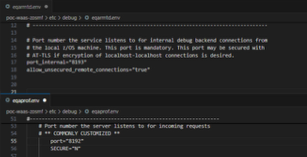
Set these variables to disable SSL:
# In eqaprof.env
SECURE="N"
# In eqarmtd.env
allow_unsecured_remote_connections="true"
The example below shows the variables used to disable secure connections for each service port.

Restart Services
Apply changes by cancelling and restarting the RDS(EQARMTD) and DPS(EQAPROF) started tasks from VS Code's z/OS Console:
C EQAPROF
C EQARMTD
S EQAPROF
S EQARMTD
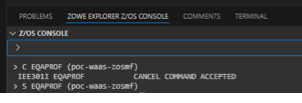
Verify changes in each started task's STDOUT log. Check STDERR for configuration errors.

Step 4: Configure VS Code launch.json
The launch.json file defines how Z Open Debug launches or attaches the debugger to your application.
Create launch.json
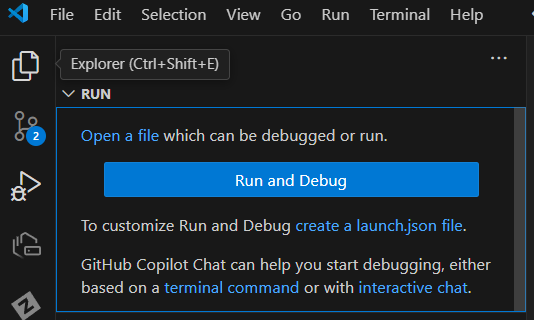
- Open the Run and Debug view (Ctrl+Shift+D / Cmd+Shift+D)
- Click "create a launch.json file"
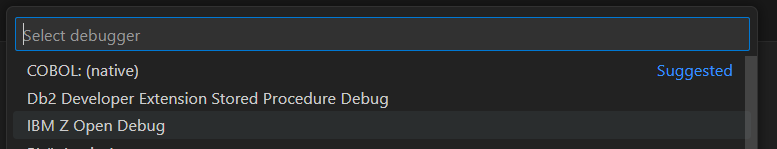
- Select IBM Z Open Debug
- Add your z/OS debugger settings
Sample Configuration: Available in the Z Open Debug extension page.
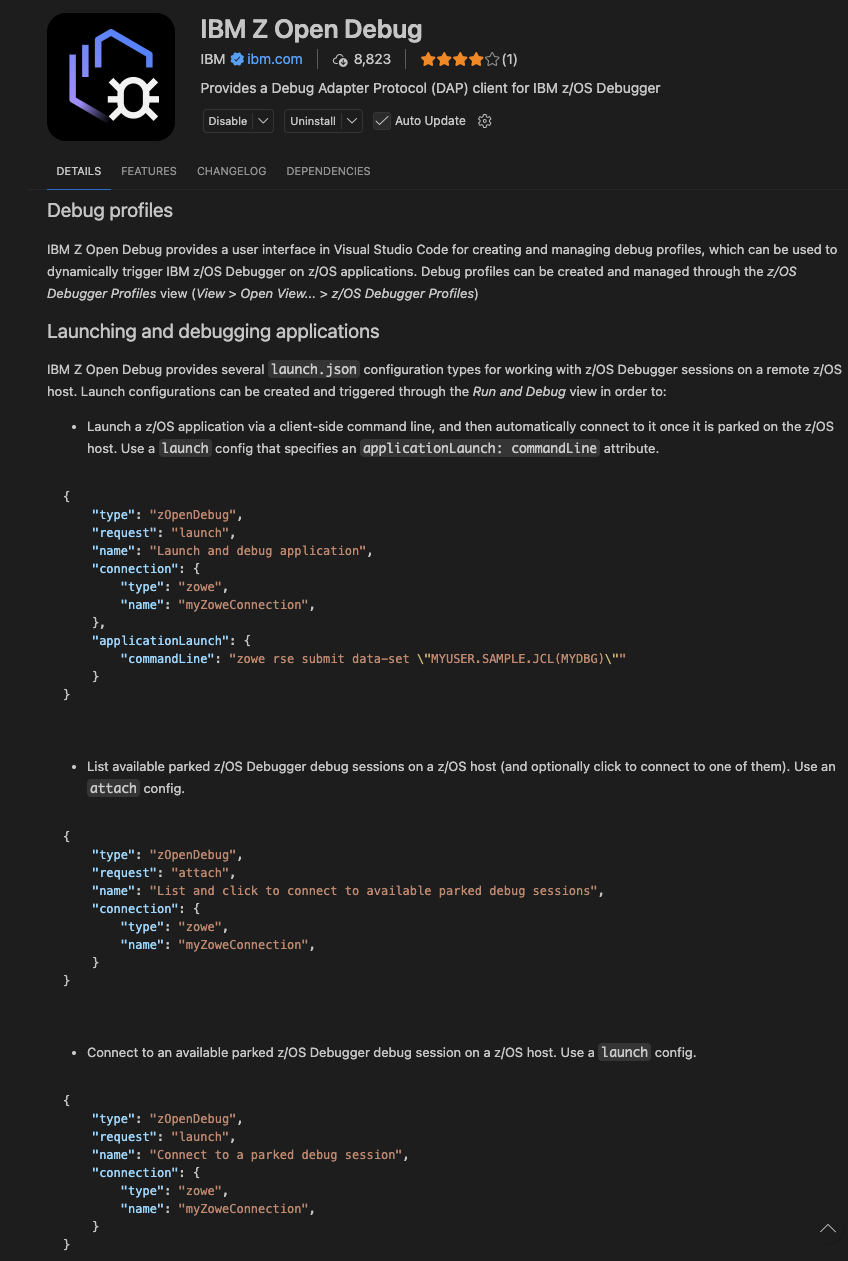
Configuration Types
Launch Request (for Batch programs):
- Launches and parks a batch program, causing it to wait for debugger attachment
- Uses SSH or JCL submission to start the program
Attach Request (for all programs):
- Lists available parked debug sessions, and allows clicking on them to debug
- Works for both CICS and Batch
Step 5: Prepare Programs for Debugging Using DBB v3
Programs must be compiled with debug options to display source code during debugging.
Using DBB v3
Configure your dbb-app.yaml project file:
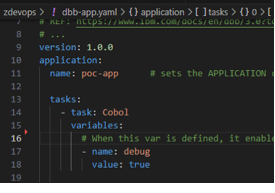
This translates to the TEST compiler option in your language configuration (e.g., Cobol.yaml).
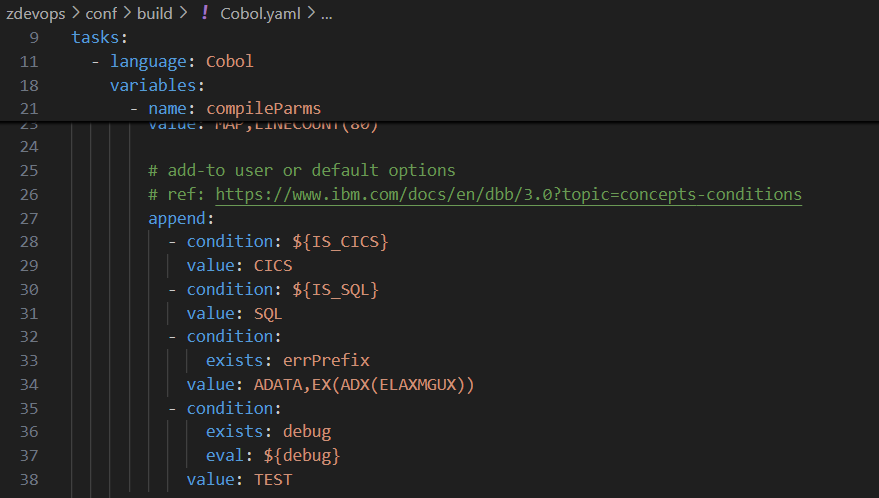
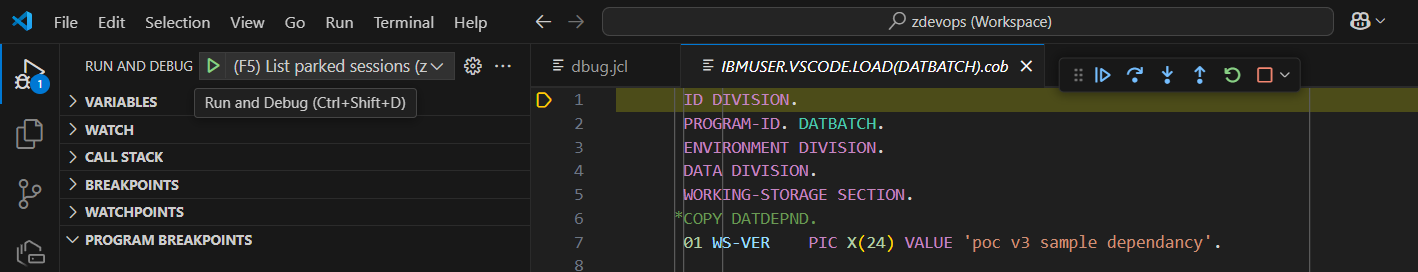
Without TEST Option: Programs appear as disassembled machine code in the debug session:

Deployment
- CICS: Run NEWCOPY for the new executable; ensure load PDS is in the CICS region's RPL DD
- Batch: Ensure load library is accessible in JCL STEPLIB
Debugging CICS Transactions
Create a CICS Debug Profile
- In Zowe Explorer's Z/OS DEBUGGER PROFILES, right-click CICS
- Select "Create Debug Profile"
- Enter:
- Profile Name: Descriptive name for this profile
- Zowe Connection: Previously created connection profile
- CICS Region: Target CICS region name
- Transaction ID: Transaction to debug
- Click the Save icon (top right)
Activate the Profile
- Right-click the CICS profile
- Select "Activate"
Important: Debug profiles remain active even after IDE shutdown or disconnect. Remember to deactivate profiles after debugging sessions.
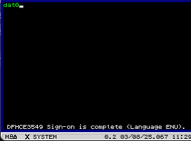
Park the Transaction
- From a 3270 terminal, start the transaction, for example CICS transaction “DAT0” is started and waiting on a 3270 terminal:
- The transaction will park (pause) at its entry point
- The debug engine takes control and waits for VS Code attachment
Note: Parked sessions remain indefinitely or until a timeout (configured in eqarmtd.env).
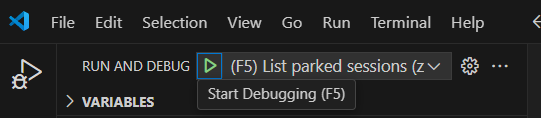
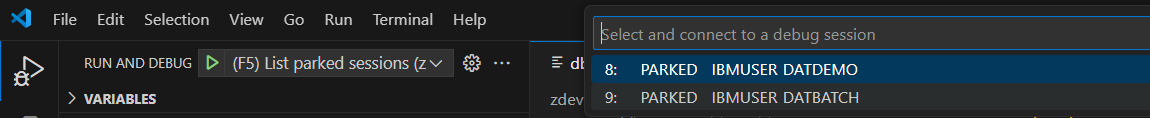
Attach to the Parked Session
- In VS Code's Run and Debug view, select the "List parked sessions" configuration
- Click the green Start Debugging arrow
- Select the parked session from the dropdown list
- The debug session begins
If no parked sessions are found, a notification appears at the bottom of VS Code.
Debug the CICS Application
The source code displays with:
 Debug toolbar (top right): Continue, Step Over, Step Into, Step Out, Restart, Stop
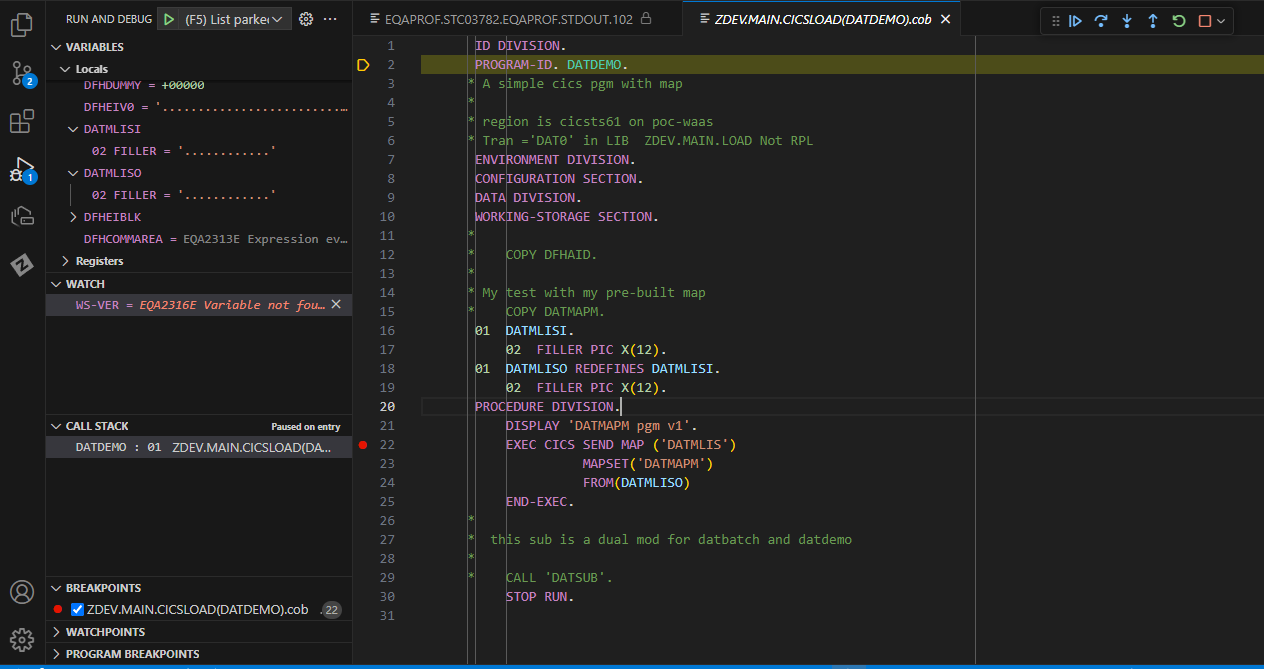
- Debug panels (left sidebar):
- Variables: View and modify program variables
- Watch: Monitor specific expressions
- Call Stack: View execution path
- Breakpoints: Manage breakpoints
Debugging Actions:
- Set Breakpoints: Click next to line numbers (red dots appear)
- Step Through Code: Use toolbar buttons or keyboard shortcuts
- Inspect Variables: Hover over variables or use Variables panel
- Modify Values: Right-click variables to change values
- Evaluate Expressions: Use Debug Console
Debugging Batch Programs
Method 1: Launch Configuration (Recommended)
Configure a launch request in launch.json with the applicationLaunch attribute. The applicationLaunch specifies an arbitrary client-side command line that can be used to launch your application on the remote z/OS machine. For instance, ssh or Zowe CLI commands can be used to submit JCL that launches your application with the appropriate debug runtime options:
{
"type": "ibmzopendebug",
"request": "launch",
"name": "Launch Batch Program",
"zoweProfile": "zOpenDebug",
"applicationLaunch": {
"commandLine": "submit /path/to/myjob.jcl"
}
}
Workflow:
- Press the green arrow in the Debug toolbar
- If not connected, enter z/OS credentials when prompted
- The command line specified in the applicationLaunch attribute will be invoked
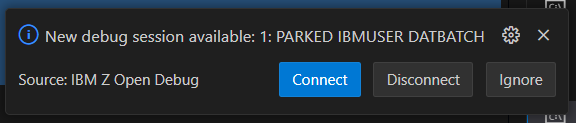
- If the applicationLaunch was able to successfully launch your application with the appropriate debug runtime options, a "New debug session available" popup should automatically appear in VS Code
- Click "Connect" to attach VS Code to it and debug immediately
Advantage: Automatic attachment - no need to manually list parked sessions.
Method 2: JCL Submission
Submit JCL with debug runtime options directly.
Option A: CEEOPTS DD Statement
//MYJOB JOB ('DEBUG'),CLASS=A,MSGCLASS=H,NOTIFY=&SYSUID
//STEP01 EXEC PGM=MYPROG,REGION=0M
//STEPLIB DD DISP=SHR,DSN=MY.LOADLIB
//SYSOUT DD SYSOUT=*
//CEEOPTS DD *
TEST(ALL,,,RDS:*)
/*
Option B: PARM Field
//MYJOB JOB ('DEBUG'),CLASS=A,MSGCLASS=H,NOTIFY=&SYSUID
//STEP01 EXEC PGM=MYPROG,PARM='/TEST(ALL,,,RDS:*)'
//STEPLIB DD DISP=SHR,DSN=MY.LOADLIB
//SYSOUT DD SYSOUT=*
Or:
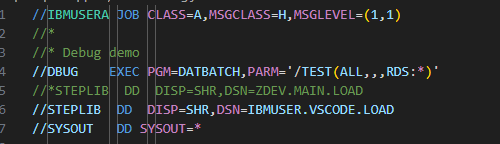
⚠️ Critical Note - Parameter Order:
- COBOL: Runtime parameters come AFTER program parameters (TEST after /)
- PL/I & Others: Runtime parameters come BEFORE program parameters (TEST before /)
- Some COBOL compile options can reverse this order
- Incorrect placement prevents debug engine from capturing the application
Attach to the Parked Batch Session
- In VS Code's Run and Debug view, select the "List parked sessions" configuration
- Click the green Start Debugging arrow
- Select the parked batch session from the dropdown
- The debug session begins
Debug the Batch Application
Same debugging capabilities as CICS:
- Set breakpoints
- Step through code
- Inspect and modify variables
- View call stack
- Use Debug Console
Debugging Best Practices
- Always Deactivate Profiles: Right-click profiles to deactivate after debugging
- Use TEST Compiler Option: Ensures source code visibility during debugging
- Verify Parameter Order: Check language-specific requirements for runtime options
- Monitor Timeouts: Be aware of parked session timeout values
- Check Logs: Review STDOUT/STDERR of EQAPROF and EQARMTD for errors
- Use SSL in Production: Only disable SSL for demo/test environments
- Leverage Launch Configs: Use applicationLaunch for streamlined batch debugging
Troubleshooting
No Parked Sessions Found
- Verify the debug profile is activated (CICS)
- Confirm TEST runtime option is correctly specified (Batch)
- Check parameter order in JCL PARM field
- Review EQARMTD logs for connection errors
Source Code Not Displayed
- Ensure program was compiled with TEST option
- Verify source file is accessible to the debugger
- Check that the correct version of the program is loaded
Connection Issues
- Verify port numbers are correct
- Check firewall rules allow connections to DPS/RDS ports
- Confirm EQAPROF and EQARMTD started tasks are running
- Review SSL certificate configuration
Authentication Failures
- Verify RACF/SAF credentials are correct
- Check user has appropriate permissions
- For token auth, ensure MFA is properly configured
Additional Resources
- IBM z/OS Debugger User's Guide
- Setting up Z Open Debug
- Preparing Programs for Debugging
- Enabling Secure Communication
- Video Tutorial: IBM Z Open Debug
- COBOL TEST Compiler Option
- VS Code Debugging Documentation
Summary
This guide provides a comprehensive walkthrough for setting up and using IBM Z Open Debug in VS Code. Key takeaways:
- Prerequisites: Ensure all components are installed and configured
- Connection Setup: Create and authenticate Zowe debug profiles
- Program Preparation: Compile with TEST option for source-level debugging
- CICS Debugging: Create profiles, activate, park transactions, and attach
- Batch Debugging: Use launch configs or JCL submission with proper TEST options
- Best Practices: Deactivate profiles, use SSL, verify parameter order
- Troubleshooting: Check logs, verify configurations, confirm authentication
For additional support, consult the IBM documentation links provided throughout this guide.
Was this topic helpful?
Document Information
Modified date:
09 April 2026
UID
ibm17267586