General Page
This report contains the results of the performance evaluation of IBM App Connect Enterprise in traditional non-containerized environments on Linux, Windows, and AIX.
Please find attached a downloadable PDF version of this report along with a browser version for your convenience.
Read the general information in the Notices section before you look at the detail in the document.
Table of Contents
The information provided in this performance report illustrates the key processing characteristics of IBM App Connect Enterprise. It is intended for architects, systems programmers, analysts, and programmers wanting to understand the performance characteristics of IBM App Connect Enterprise. The data provided will assist the reader in understanding the performance characteristics of the product when deployed on any of the operating systems that are covered in this report. Please note that it is assumed that the reader is familiar with the concepts and operation of IBM App Connect Enterprise.
This information has been obtained by measuring the message throughput for a number of different types of message processing. The term ‘message’ is used in a generic sense and can mean any request or response into or out of an integration server, regardless of the transport or protocol.
The performance data presented in the reports was measured in a controlled environment and any results obtained in other environments might vary significantly. For more details on the measurement methodologies and environments used, see the "Evaluation Procedure" and "Test Environment" sections, respectively, of this document.
The performance measurements focus on the throughput capabilities of the integration server using different message formats and processing flows. The aim of the measurements is to help the reader understand the rate at which messages can be processed in different situations as well as to understand the relative costs of the different approaches and styles of message processing.
The performance measurements focus on the throughput capabilities of the integration server using different message formats and processing flows. The aim of the measurements is to help the reader understand the rate at which messages can be processed in different situations as well as to understand the relative costs of the different approaches and styles of message processing.
You should not attempt to make any direct comparisons of the test results in this report to what may appear to be similar tests in previous performance reports. This is because the contents of the test messages are significantly different as is the processing in the tests. In many cases the hardware, operating system, and prerequisite software are also different, making any direct comparison invalid.
In many of the tests the user logic is minimal, and the results represent the best throughput that can be achieved. This should be borne in mind when using the data in this report.
References to IBM products or programs do not imply that IBM intends to make these available in all countries in which IBM operates. Information contained in this report has not been submitted to any formal IBM test and is distributed ‘as is’. The use of this information and the implementation of any of the techniques is the responsibility of the customer. Much depends on the ability of the customer to evaluate this data and project the results to their operational environment.
All of the tests running in IBM App Connect Enterprise are run on a single operating system image that is natively installed on the hardware.
For tests that require IBM MQ, MQ is run on the same system under test.
Additionally, two more servers can be run depending on the test case. The first is an “HTTP Server” that serves requests for an HTTP Connector node if it is required as part of the test case and the second is a “Mock Server” that serves requests from any SaaS connector node if it is a part of a test. The actual requests to any SaaS endpoint are intercepted and served by this Mock Server. This is done to avoid any rate limiting that might be imposed by the SaaS provider. Both these servers run on a different machine that is in the same network as the “Test System”.
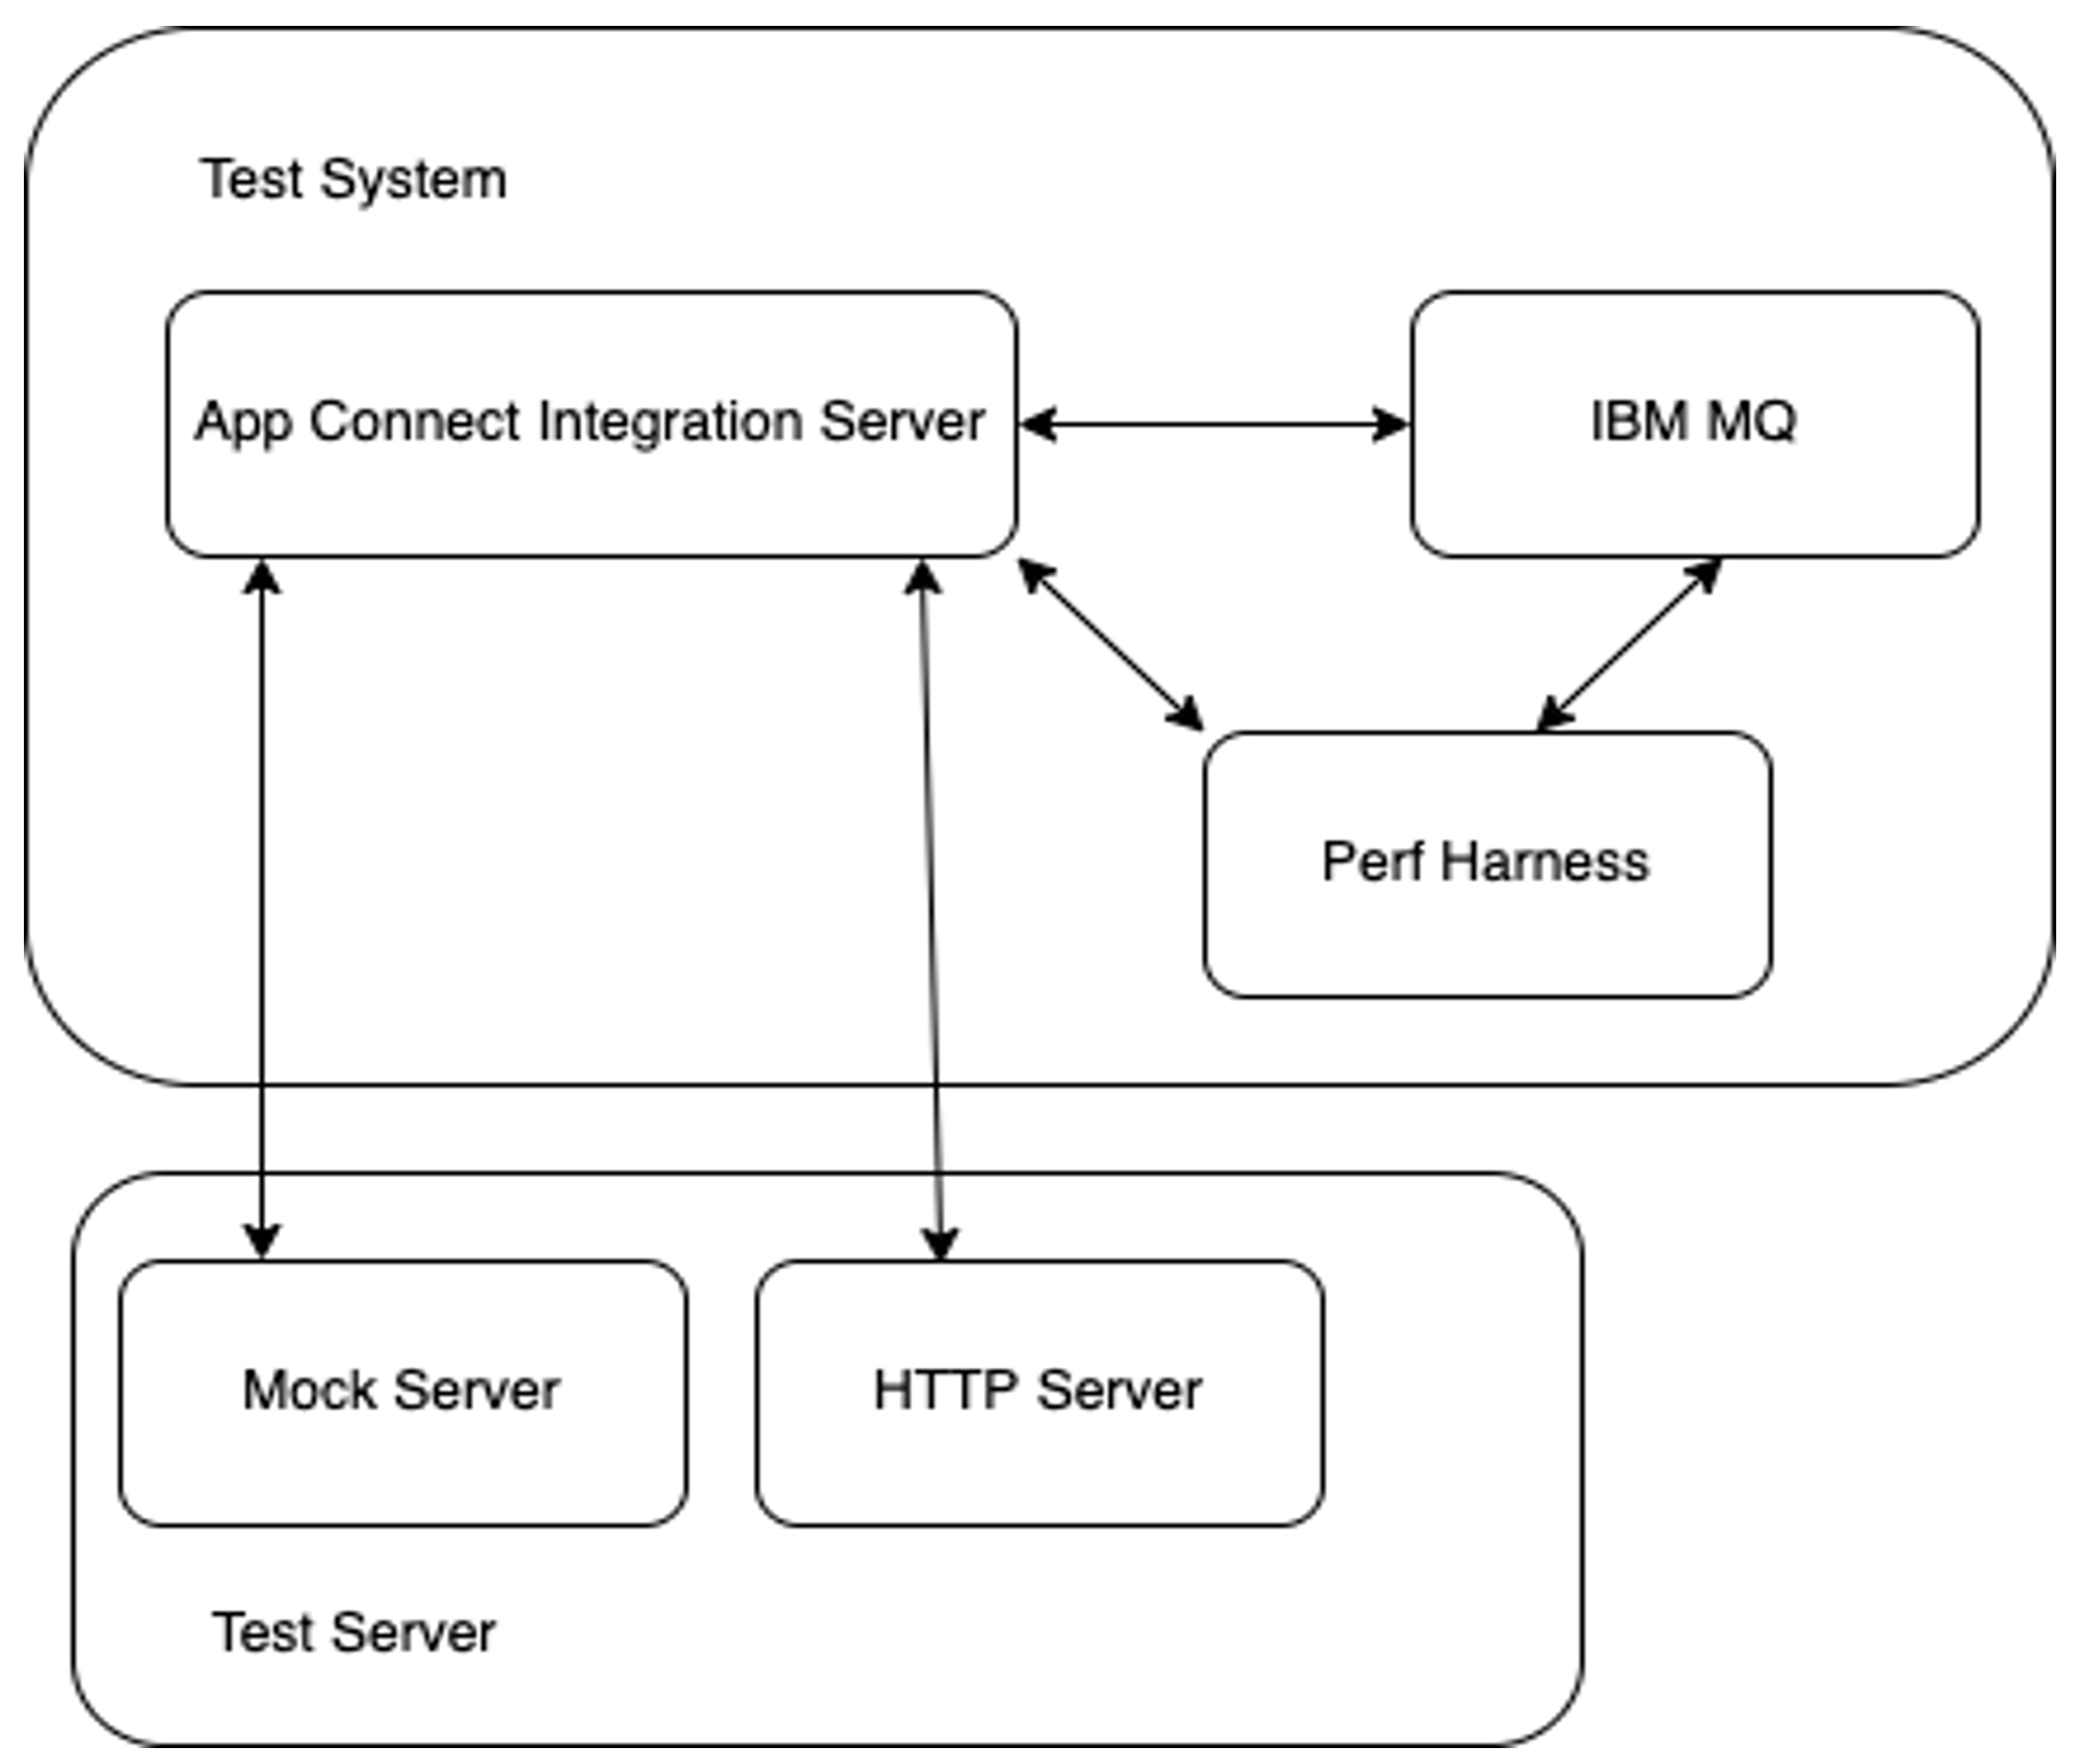
The open source “PerfHarness” tool is used to simulate client activity when using the MQ, HTTP or TCP/IP transport protocols.
Regardless of the transport protocol used, a number of PerfHarness client threads concurrently send prefabricated payload messages to the system under test, wait for and get a response, and keep repeating this synchronous request-response interaction with the same payload for the duration of the test. The collective of all request-response interactions that have taken place during a predefined time interval are referred to as a test run.
The HTTP transport is used synchronously for request and response processing and there is no pipelining of requests on a connection. The connections are kept open for a predefined number of request-response interactions as allowed by the HTTP persistent connections scheme. When the predefined number is reached, the connection is closed and a new one is opened in its place. This process is repeated on each connection until the predefined length of the test runs out, at which point all connections are closed regardless of how many requests have been sent over them, but not before a reply has been received for the request currently in flight over the connection if there is one - and there can only be at most one request outstanding as there is no pipelining of requests.
When using MQ, PerfHarness client threads put prefabricated MQ payload messages to a queue designated as an input to the test case, synchronously wait for and get a response from the designated output queue. This cycle of put-get activity is repeated for the duration of the test. As is the case with HTTP, the response to all in-flight requests is obtained before ending a test run.
Some tests generate messages on other MQ queues in addition to the output queue; in such cases additional PerfHarness clients are used to consume the messages from these extraneous queues to avoid them filling up and impacting the test run.
For each test that is run, metrics are captured including, but not limited to, the number of messages processed or the number of iterations (which is a complete request-response interaction between the client and the server), the throughput rate or the message rate, which is arrived at by dividing the number of iterations by the length of the test run.
Additionally, resource metrics including, but not limited to, the CPU utilization and the memory utilization of the integration server over the period of the test are collected.
The CPU cost of processing a message over a test run is calculated. This is obtained using the CPU time consumed by the integration server divided by the number of request-response interactions.
The Integration Server’s available CPU capacity is set according to the “concurrency” level and wherever possible, it is the goal to keep the load such that the average CPU utilization over the length of the test is greater than 80%.
For each throughput test the following application metrics are reported:
- The number of messages.
- Throughput rate or Message Rate.
- The number of messages.
- Throughput rate or Message Rate.
And the following resource metrics are reported:
- Average CPU utilization.
- Average Memory utilization.
- Average CPU utilization.
- Average Memory utilization.
For a number of reasons (CPU cache coherence, memory locality, network collisions, etc.) that are unrelated to App Connect Enterprise there is some variation in the measurements results and for this reason tests are run multiple times to ensure that results are comparable. These test runs can be up to 300 seconds in length.
Additionally , another metric called “CPU Cost per Message“ is also calculated. This is the CPU time consumed by the Integration Runtime divided by the number of request-response interactions which yields the average CPU cost of processing a message over a test run.
Different test environments are used for each of the operating systems covered in this report. The details of the software and hardware used for each environment is as follows:
- For xLinux: Red Hat Enterprise Linux release 8.10 (Ootpa) installed on an IBM x3850 X6 system consisting of Intel(R) Xeon(R) CPU E7-4820 v2 @ 2.00GHz (16 CPUs , 32 cores ) with hyperthreading enabled with 62Gi RAM.
- For AIX: IBM AIX 7.2.0.0 installed on an IBM Power System S822 (8284-22A) with 8 processors @ 4157 MHz and 4-way hyperthreading (32 logical cores in total), with 122 GB RAM.
- For Microsoft Windows: Microsoft Windows Server 2022 Datacentre installed on an IBM System x3650 M3 with Intel(R) Xeon(R) CPU X5675 @3.07GHz (2x6 - 12 logical cores) with 32GB RAM.
The following software is configured in the test environment:
- IBM App Connect Enterprise Version 13.0.1.0.
- IBM MQ Version 9.4.1.0 on Linux and 9.3.3.0 on Windows and AIX.
The virtual CPU cores are assigned to IBM Integration Server based on the concurrency setting for the test. For MQ the same number of virtual CPU cores is assigned in all tests.
- IBM App Connect Enterprise Version 13.0.1.0.
- IBM MQ Version 9.4.1.0 on Linux and 9.3.3.0 on Windows and AIX.
The virtual CPU cores are assigned to IBM Integration Server based on the concurrency setting for the test. For MQ the same number of virtual CPU cores is assigned in all tests.
The aim is to test the product with a default configuration wherever possible. Some items like the concurrency of execution do need to be changed in order to achieve higher CPU utilisations for the larger configurations and for this reason the number of message flow instances is one item that would be changed in a test. All the changes that are made are documented.
The "Additional instances" property of message flows, under the Workload Management group of configuration options, is set in line with the concurrency and CPU capacity requirements of the test being executed. For each test, the number of message flow instances is based on the underlying CPU allotted to the integration server.
Generally, as a rule of thumb, the number of additional instances is set to 4 * number of virtual CPU cores being allocated for the test. So, as an example, for a concurrency setting of 2 where 2 virtual CPU cores are assigned, the number of additional instances is set 4 x 2 which is 8. This methodology is used in almost all the scenarios where there are different concurrency settings. This makes it possible to achieve a high CPU utilisation for different configurations without generating excessive context-switching, which is unproductive work.
All other configurations, including the one for IBM MQ are left at the default values.
There are a number of test scenarios, described in detail further, that are used to evaluate the performance characteristics of the various functional capabilities of the product. These tests are for evaluating the message processing capacity of the software in different configurations when doing different types of processing.
The message flows for the different scenarios are designed and coded using the IBM App Connect Enterprise Toolkit.
Each test is run in three different pre-defined capacity configurations that are termed concurrency settings. The concurrency setting assigns a specific virtual CPU core value to the Integration Server.
The CPU capacity available to the integration server is restricted using OS-provided facilities such as CPU affinity masks on Linux and Windows, or Workload Manager on AIX. The test scenarios are run with a concurrency setting of 1, 2, and 4 virtual CPU cores. The constraints are applied to the App Connect Enterprise Integration Server, and MQ processes.
In all of these capacity configurations, each test is run with 4 different test message sizes of 2K, 20K, 200K and 2MB, in the format appropriate for the test case, XML or JSON. These message sizes represent the size of the input messages in the XML format. The JSON input messages represent the same functional data as their XML counterparts, but they can be smaller in size as the data format is less verbose. Nevertheless, for the sake of simplicity, the sizes are referred to using the XML equivalent message sizes.
Also note that different sets of XML messages are used for both MQ interactions and the HTTP-based interactions and that the exact sizes of the messages vary by use case.
In addition to the above, all test runs are subject to the following parameters:
- Each test is run multiple times, for up to 300 seconds.
- The number of client threads is typically set to 4 times the number of allocated virtual CPU cores for the test.
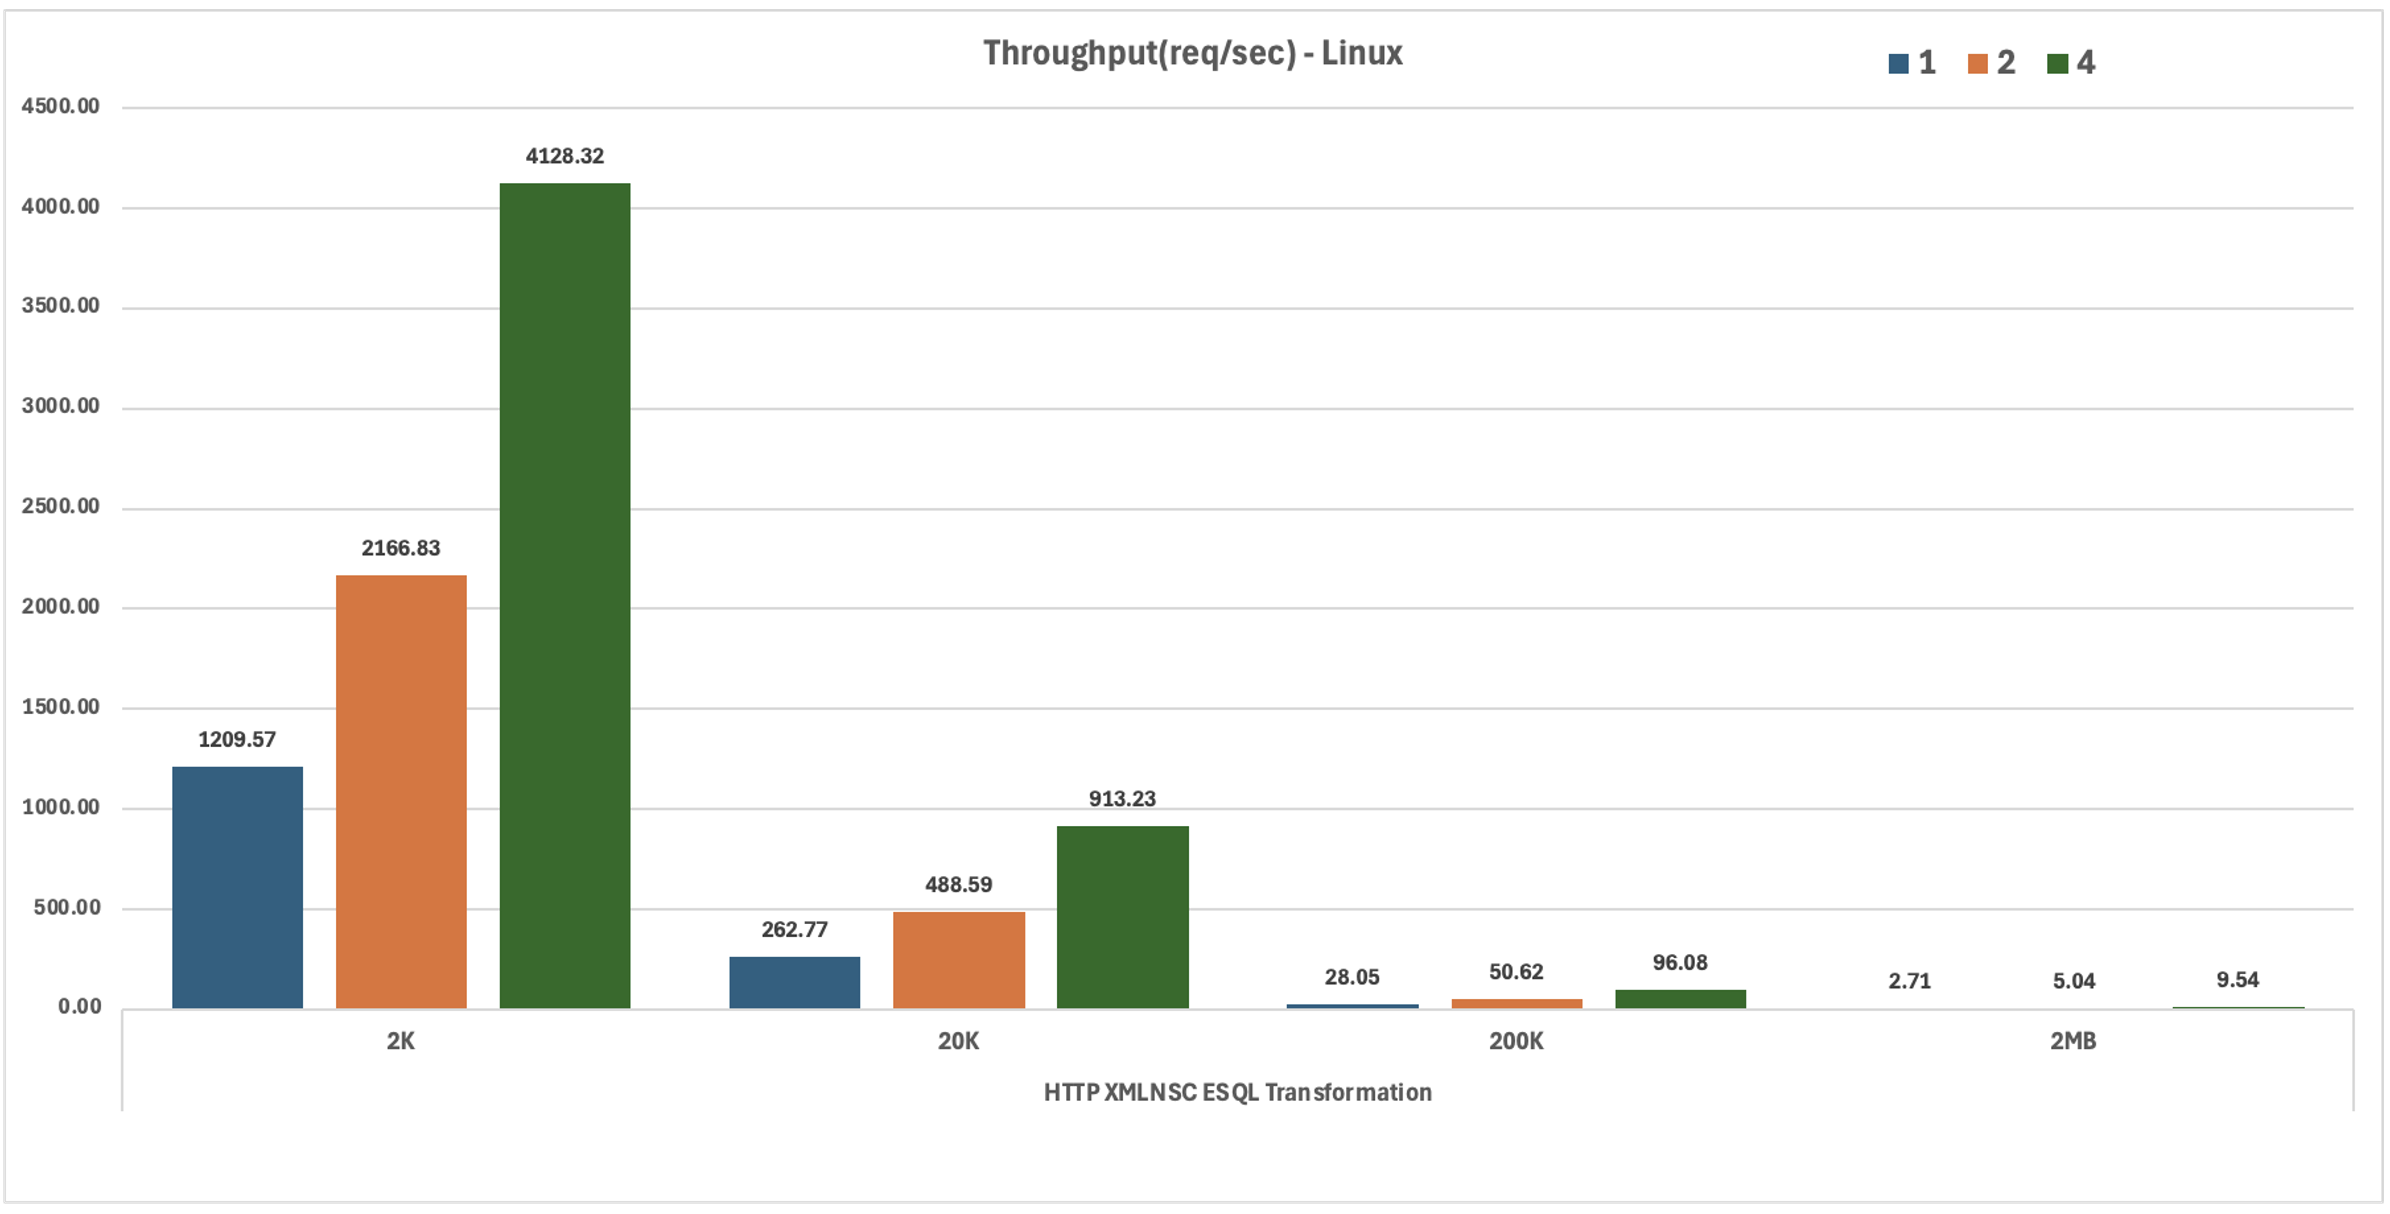
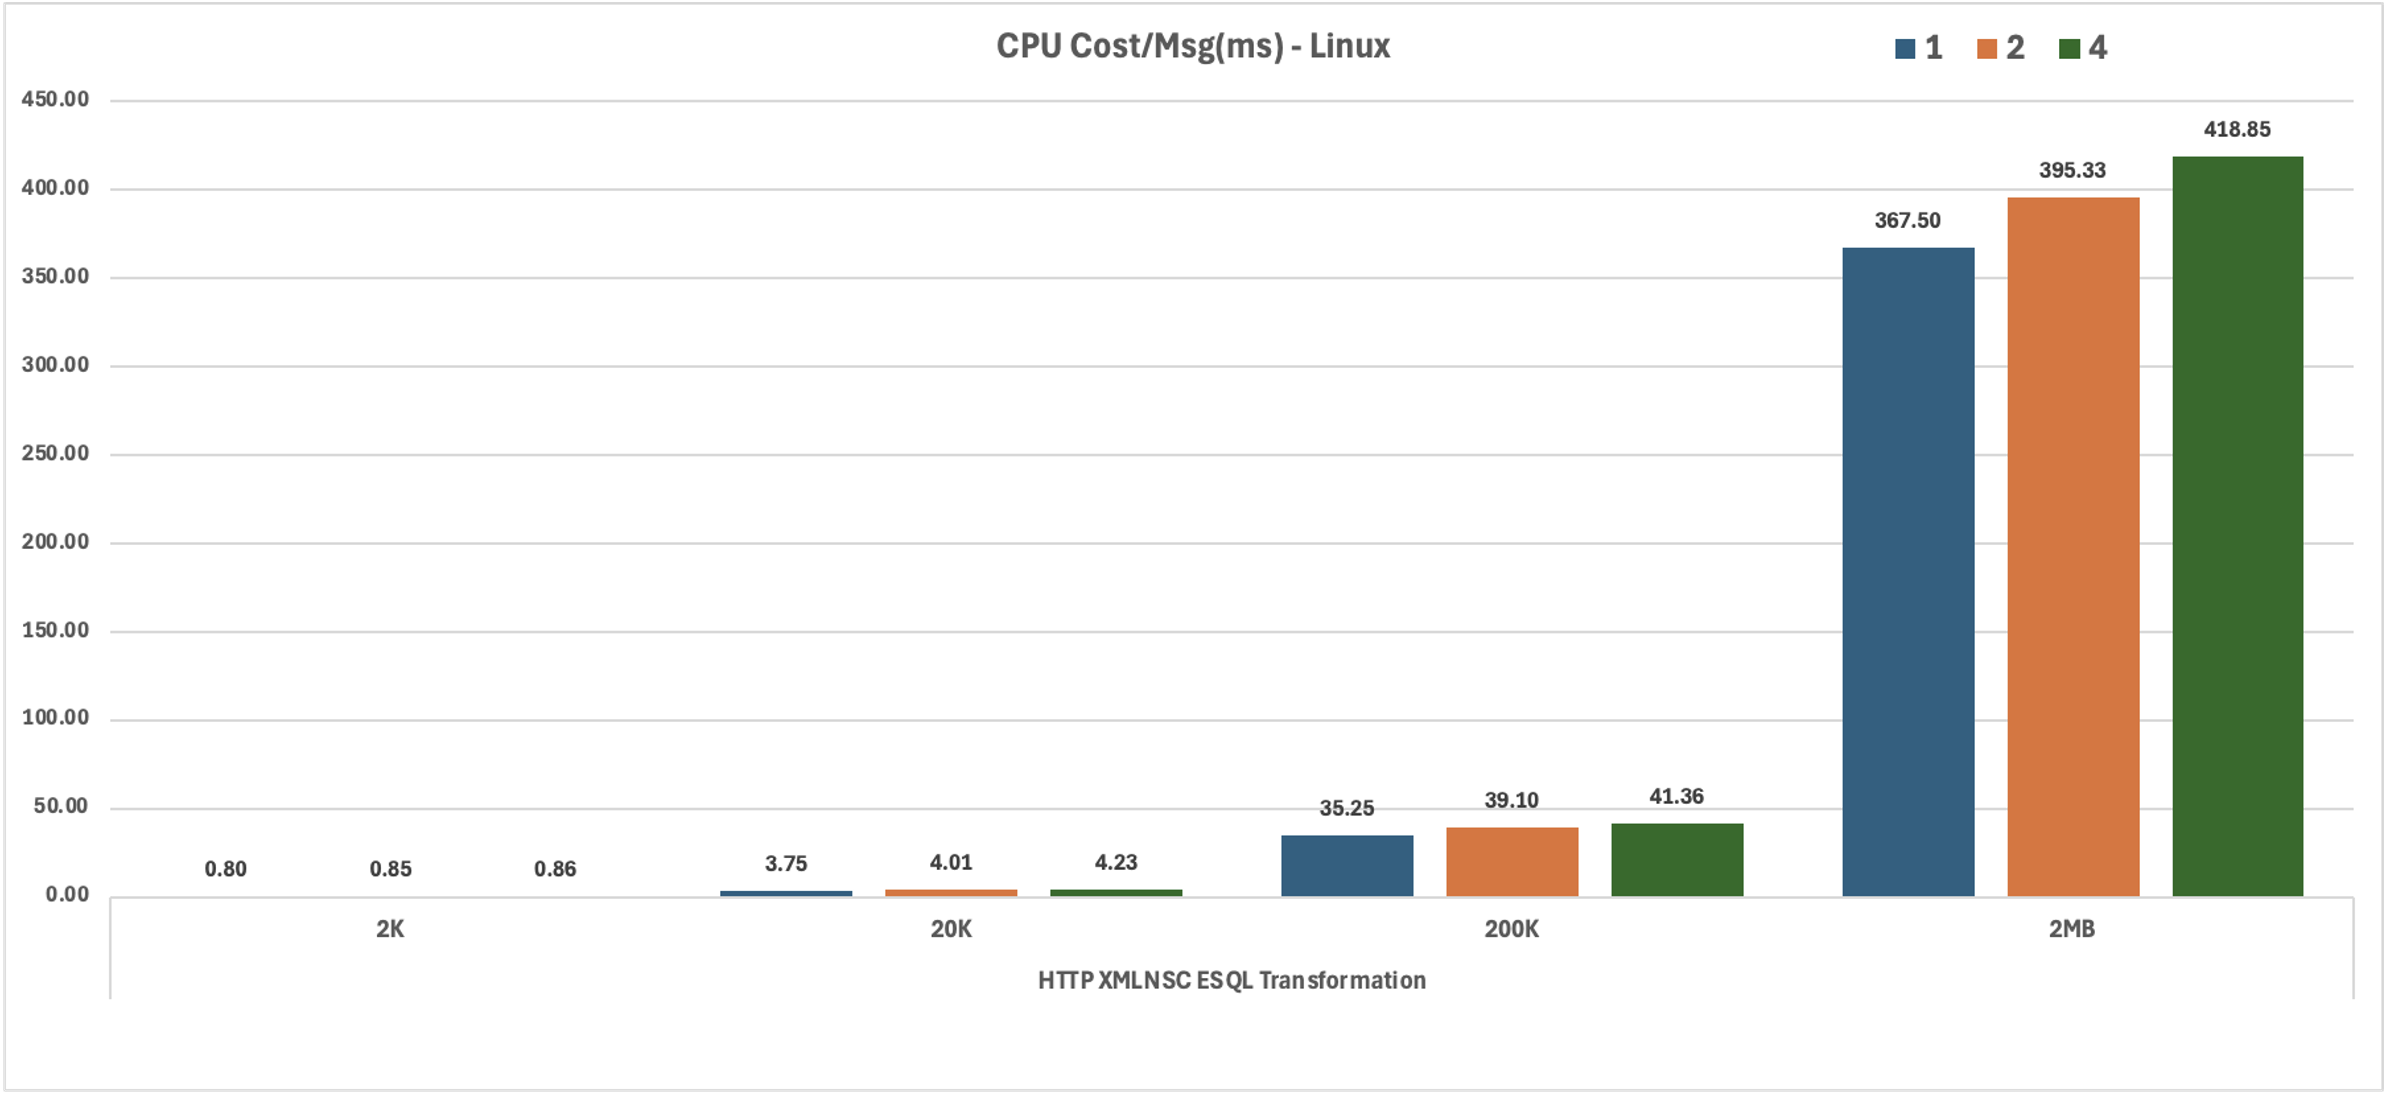
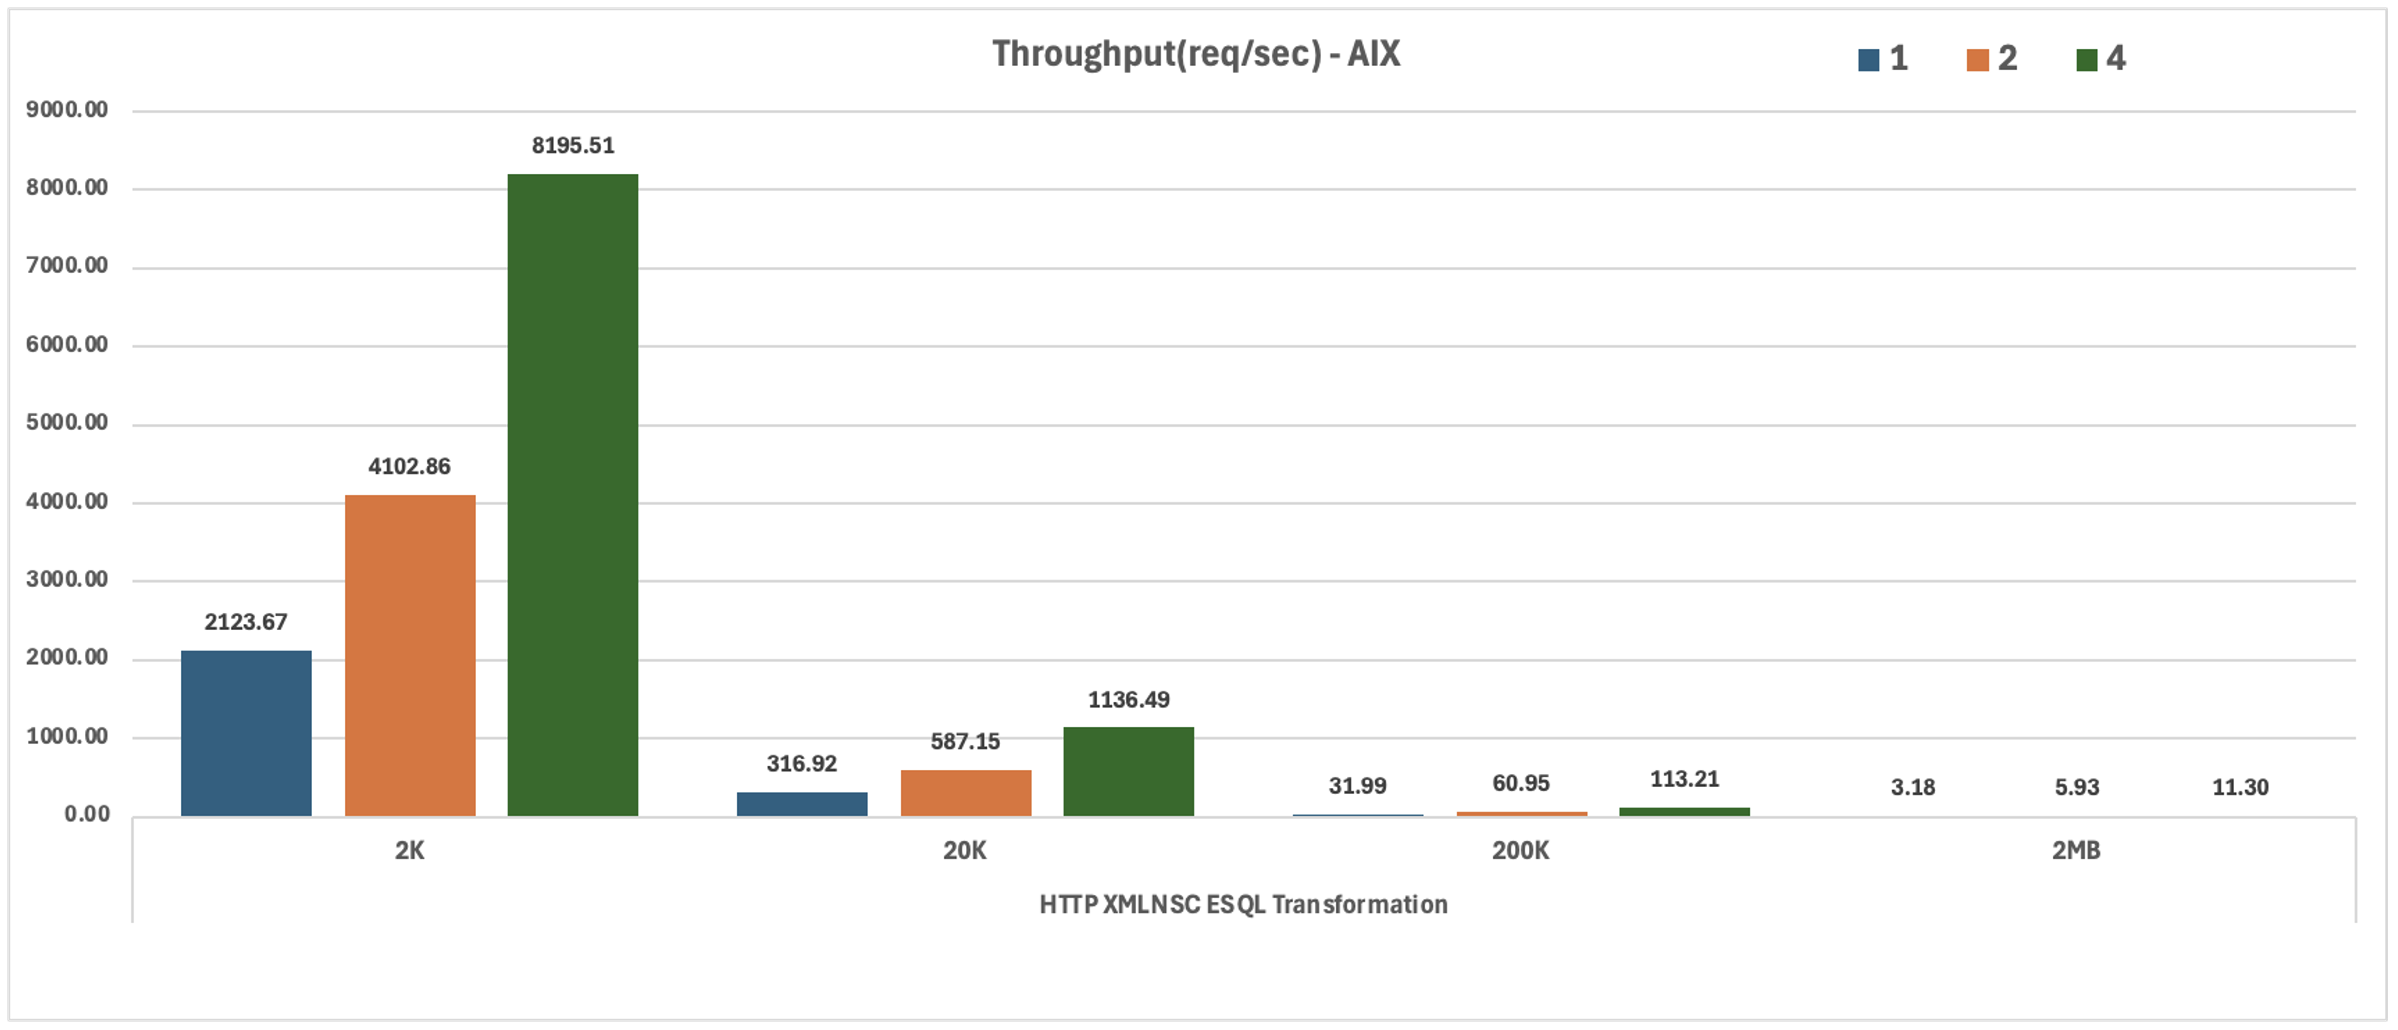
Manipulating messages in the XMLNSC domain, the HTTP XMLNSC ESQL Transformation test case used an ESQL compute node to perform a simple operation on the incoming message that requires the entire input message to be parsed, adding up numeric values scattered throughout the message and writing the sum in the XMLNSC response message. This test case evaluates the performance of a combination of HTTP transport, parsing, serialization, and ESQL transformation in the XMLNSC domain.
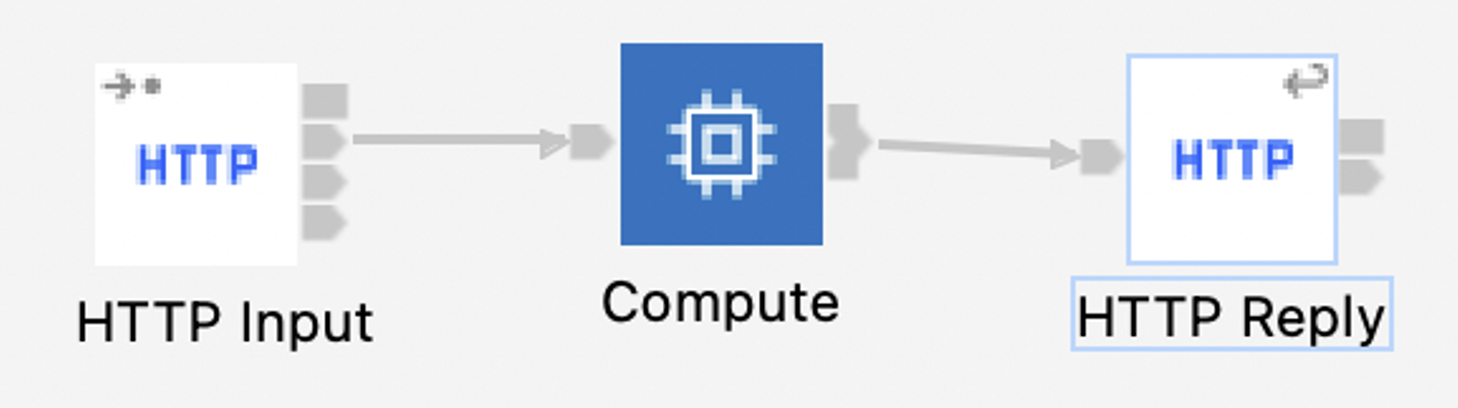
HTTP JSON ESQL Transformation
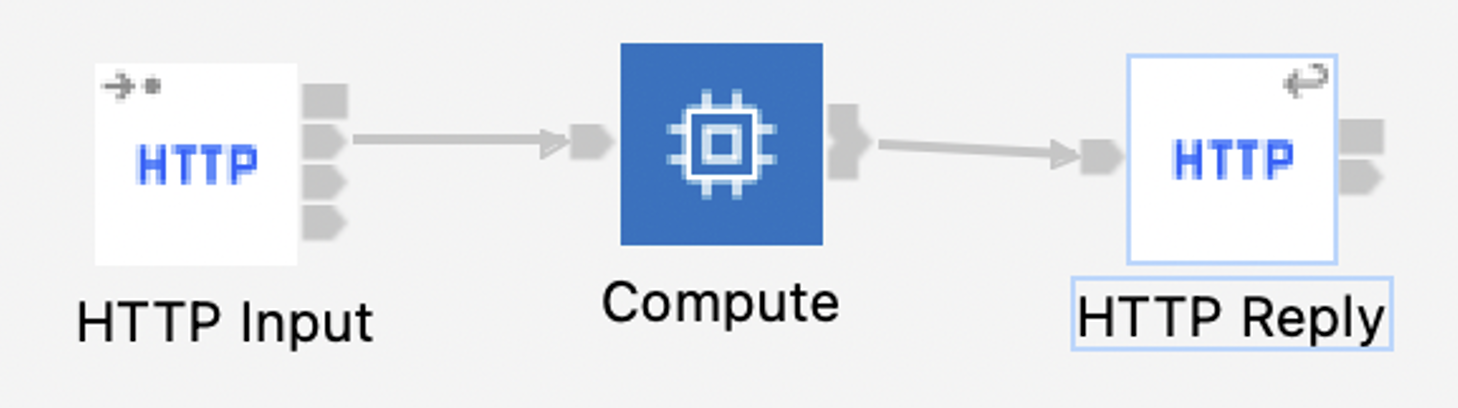
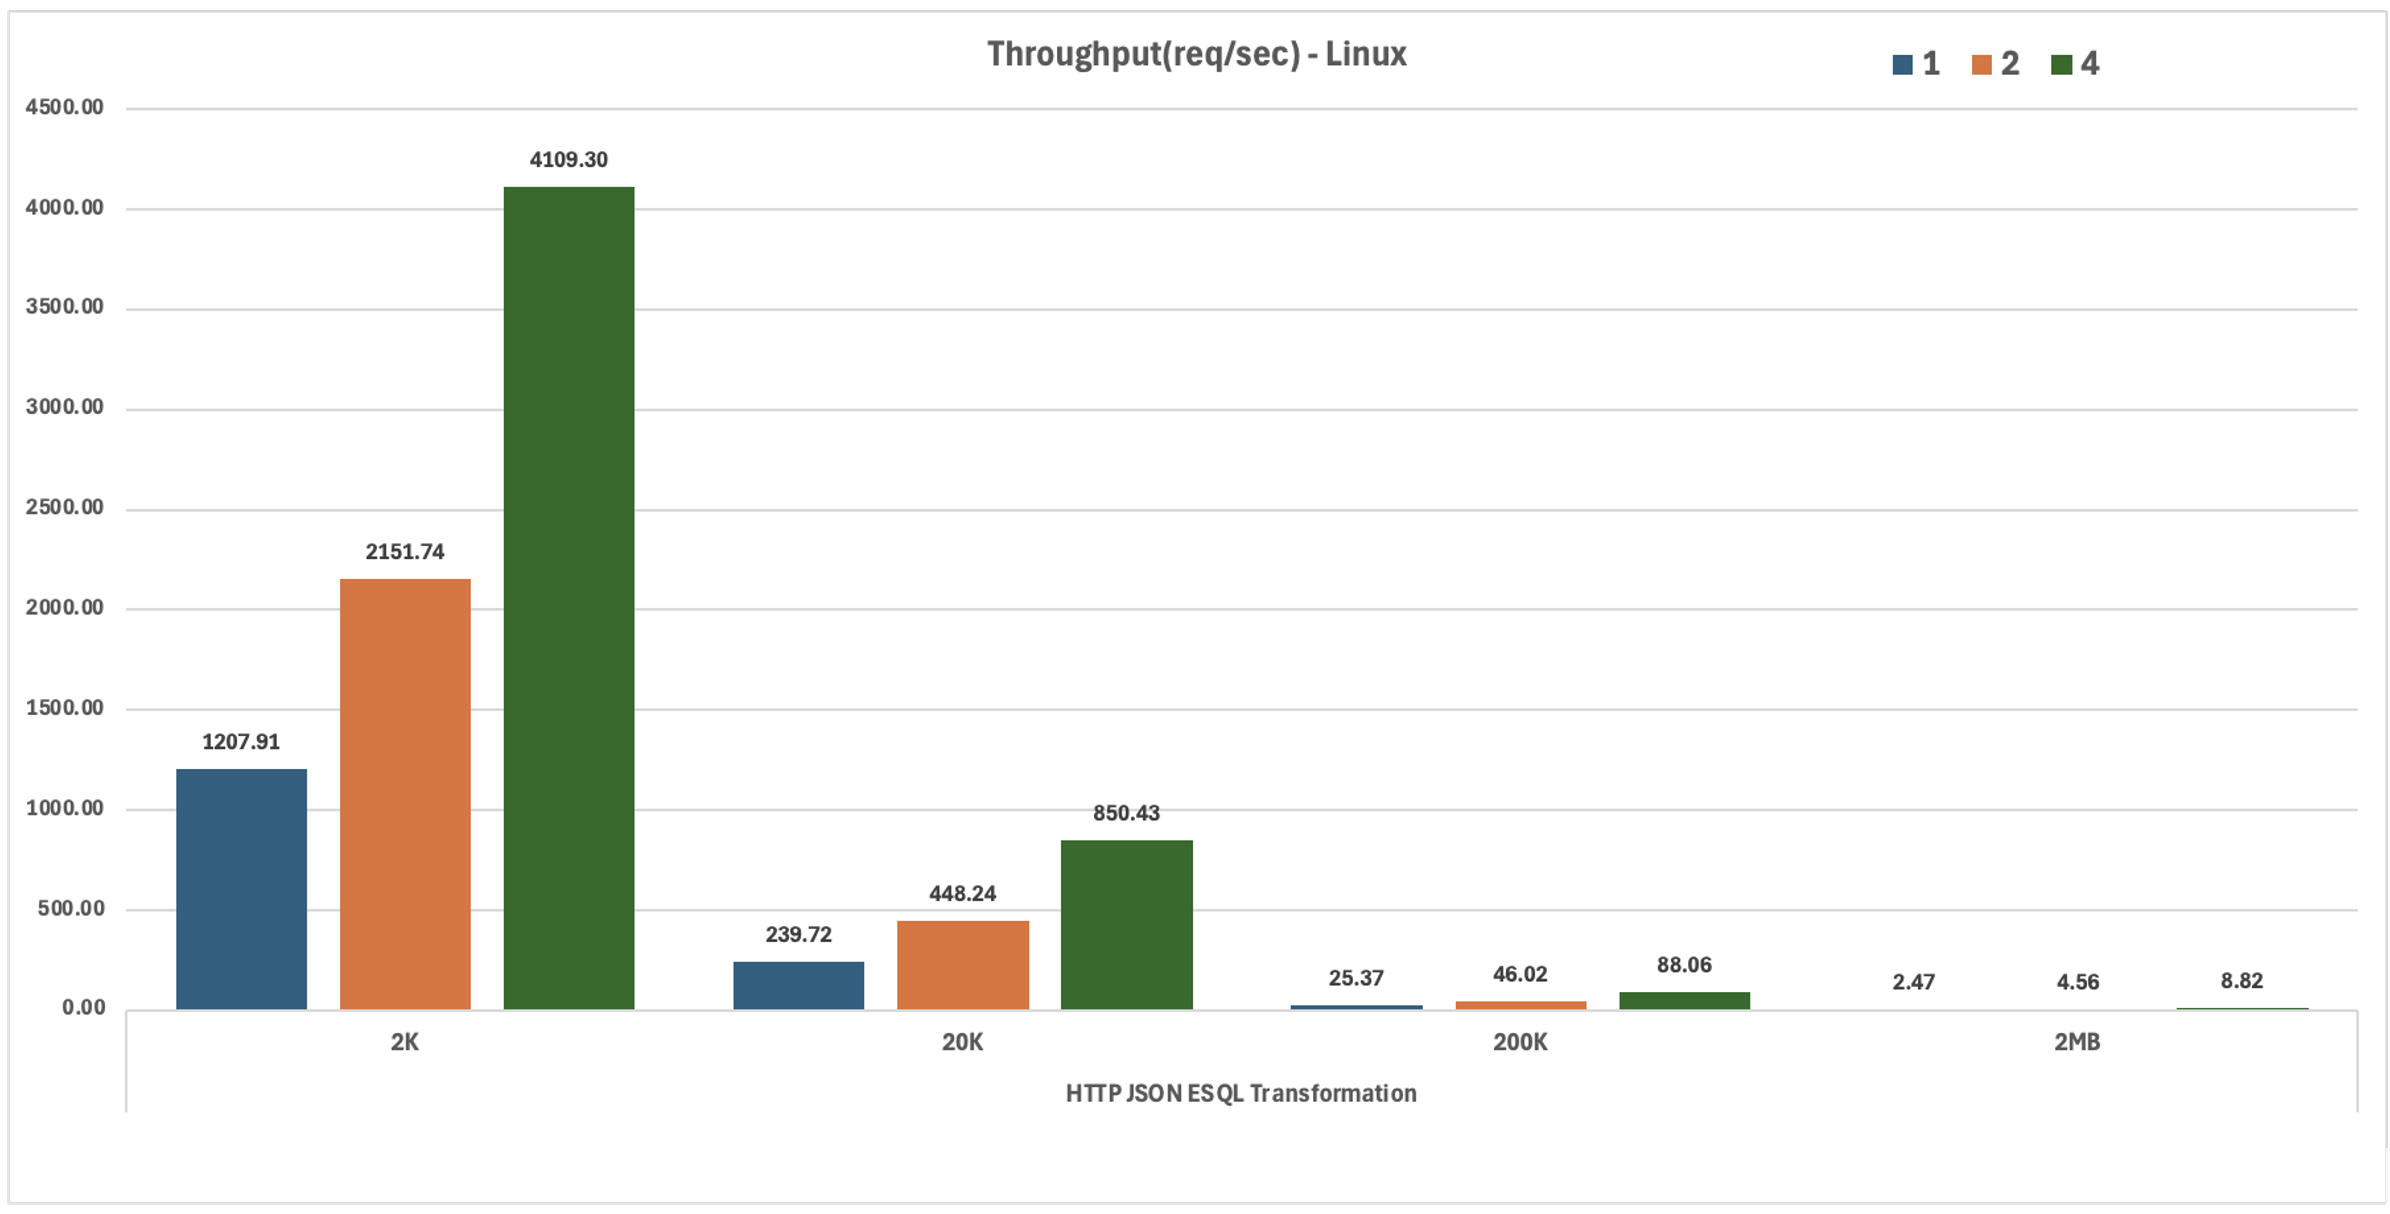
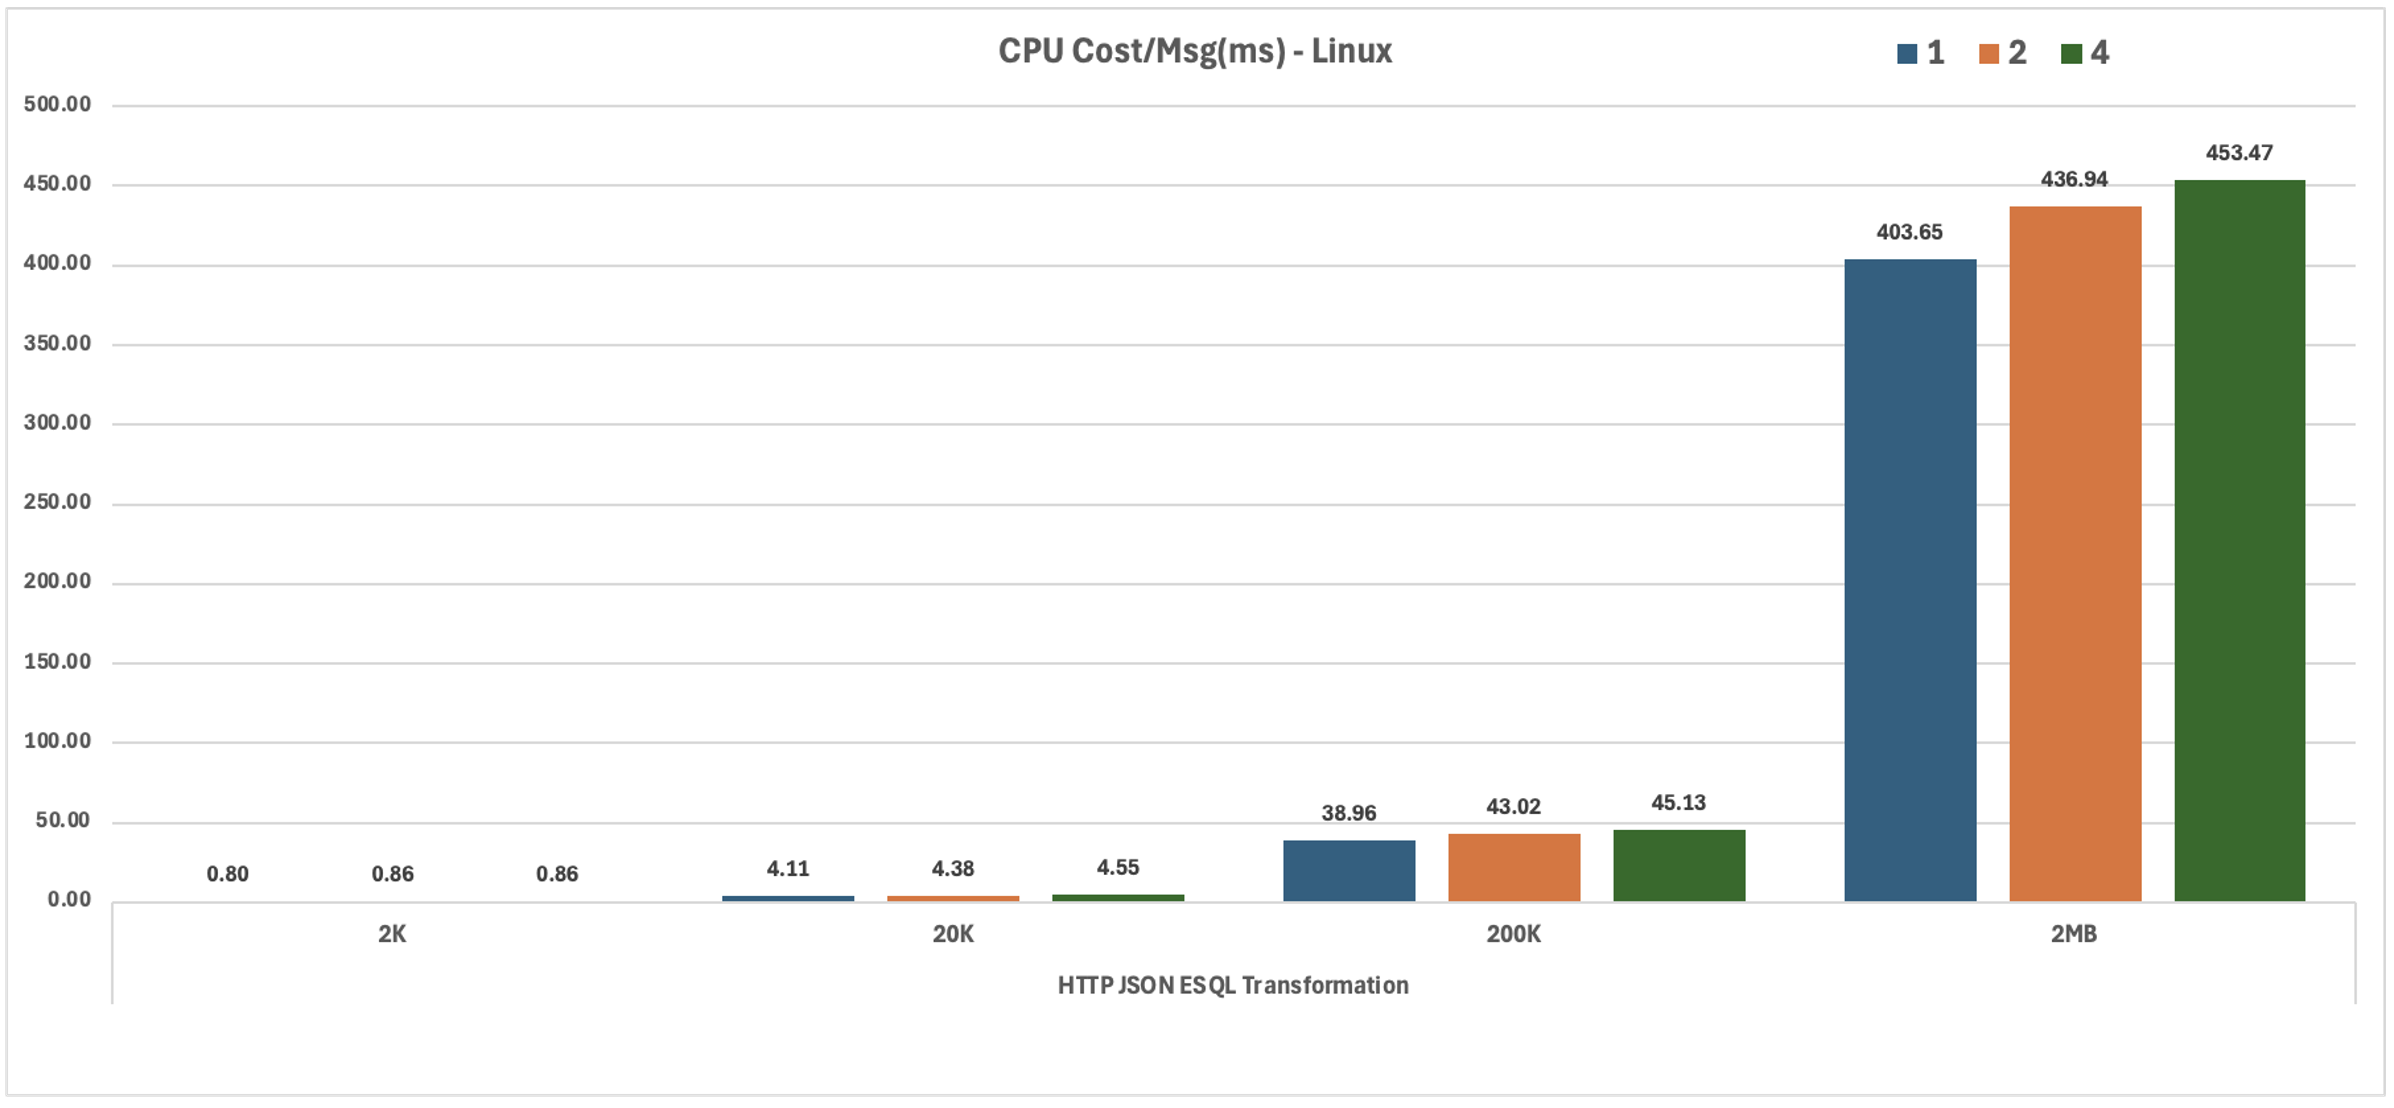
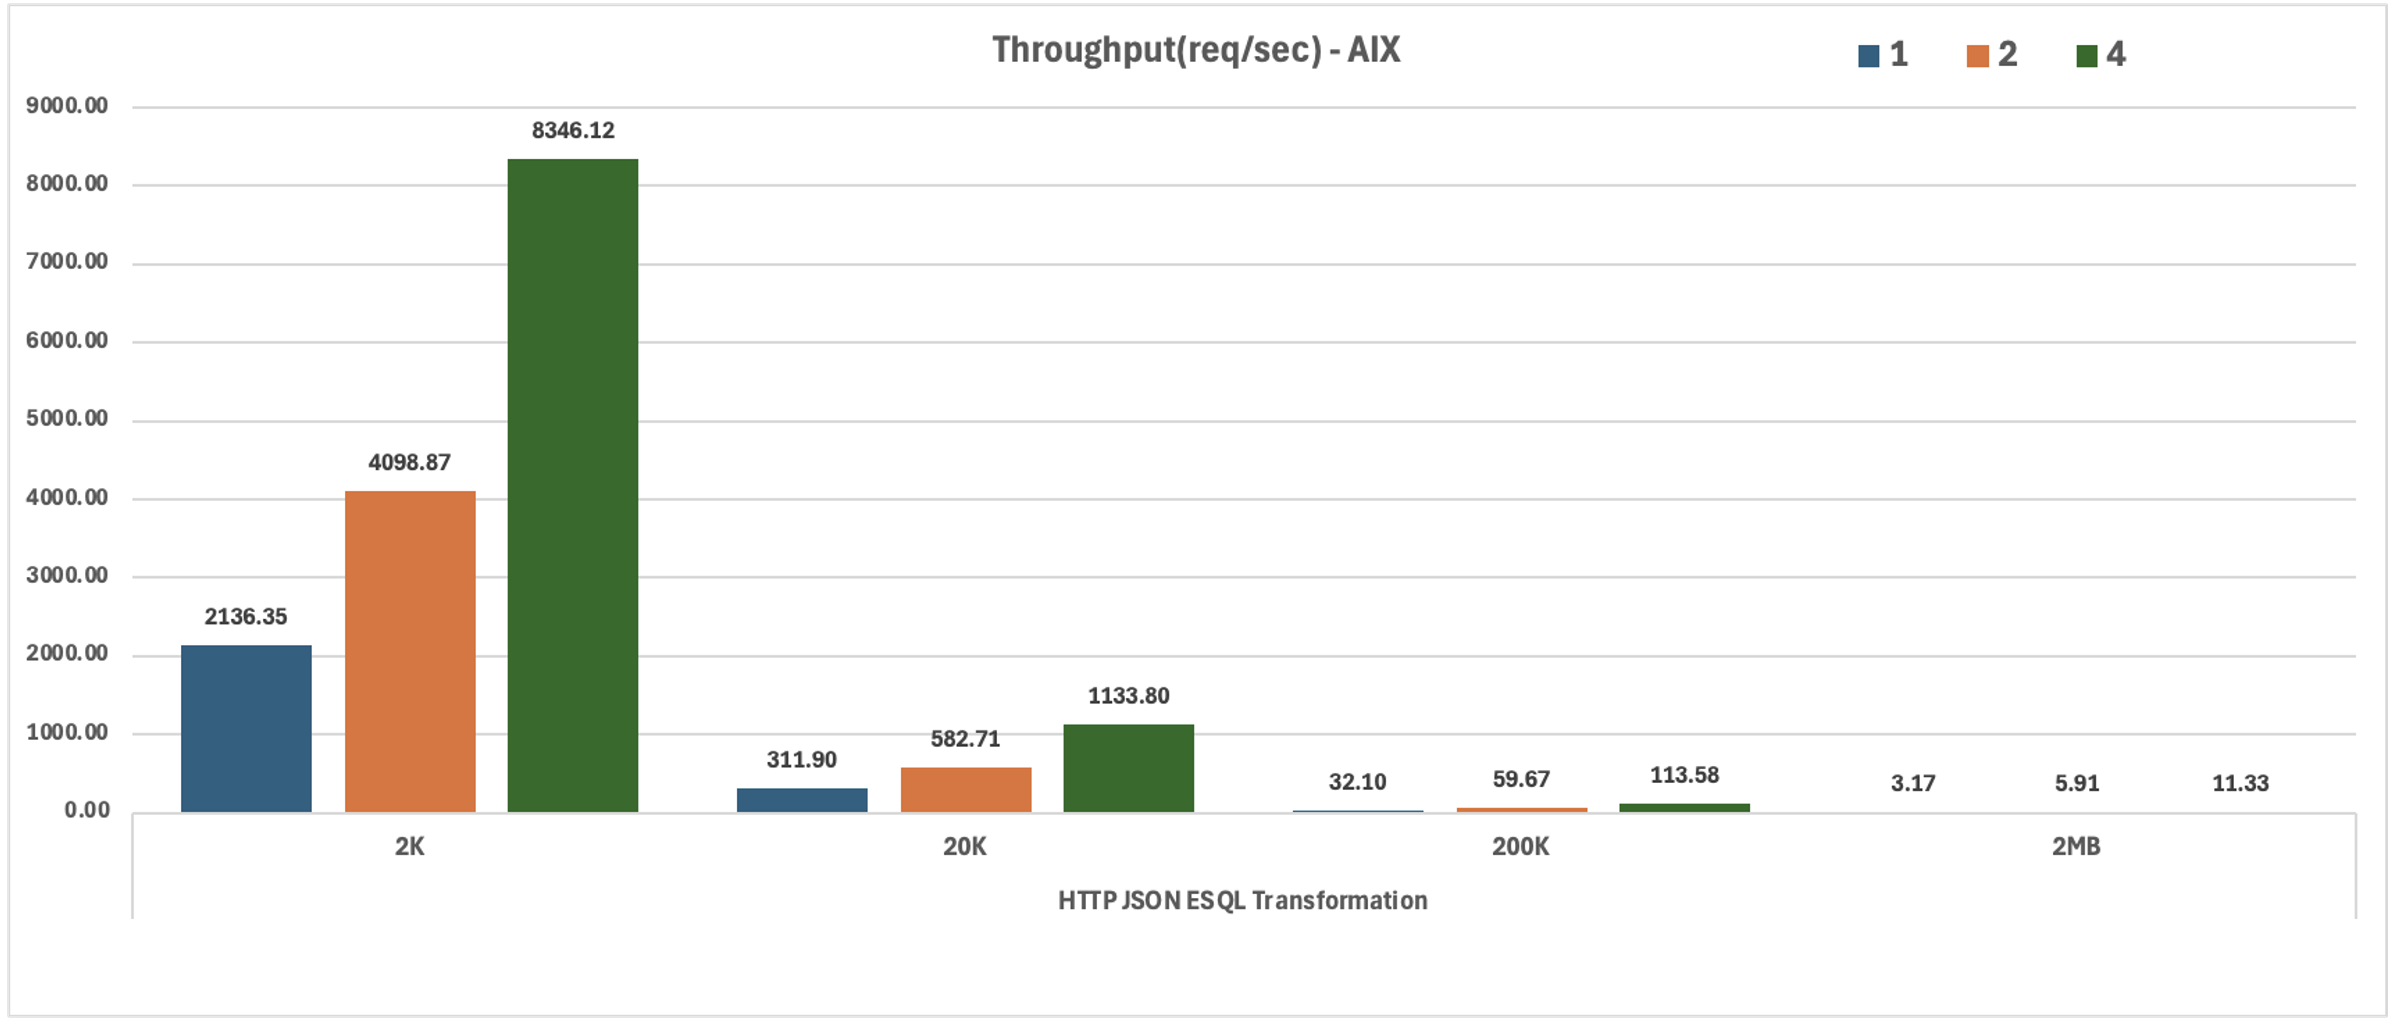
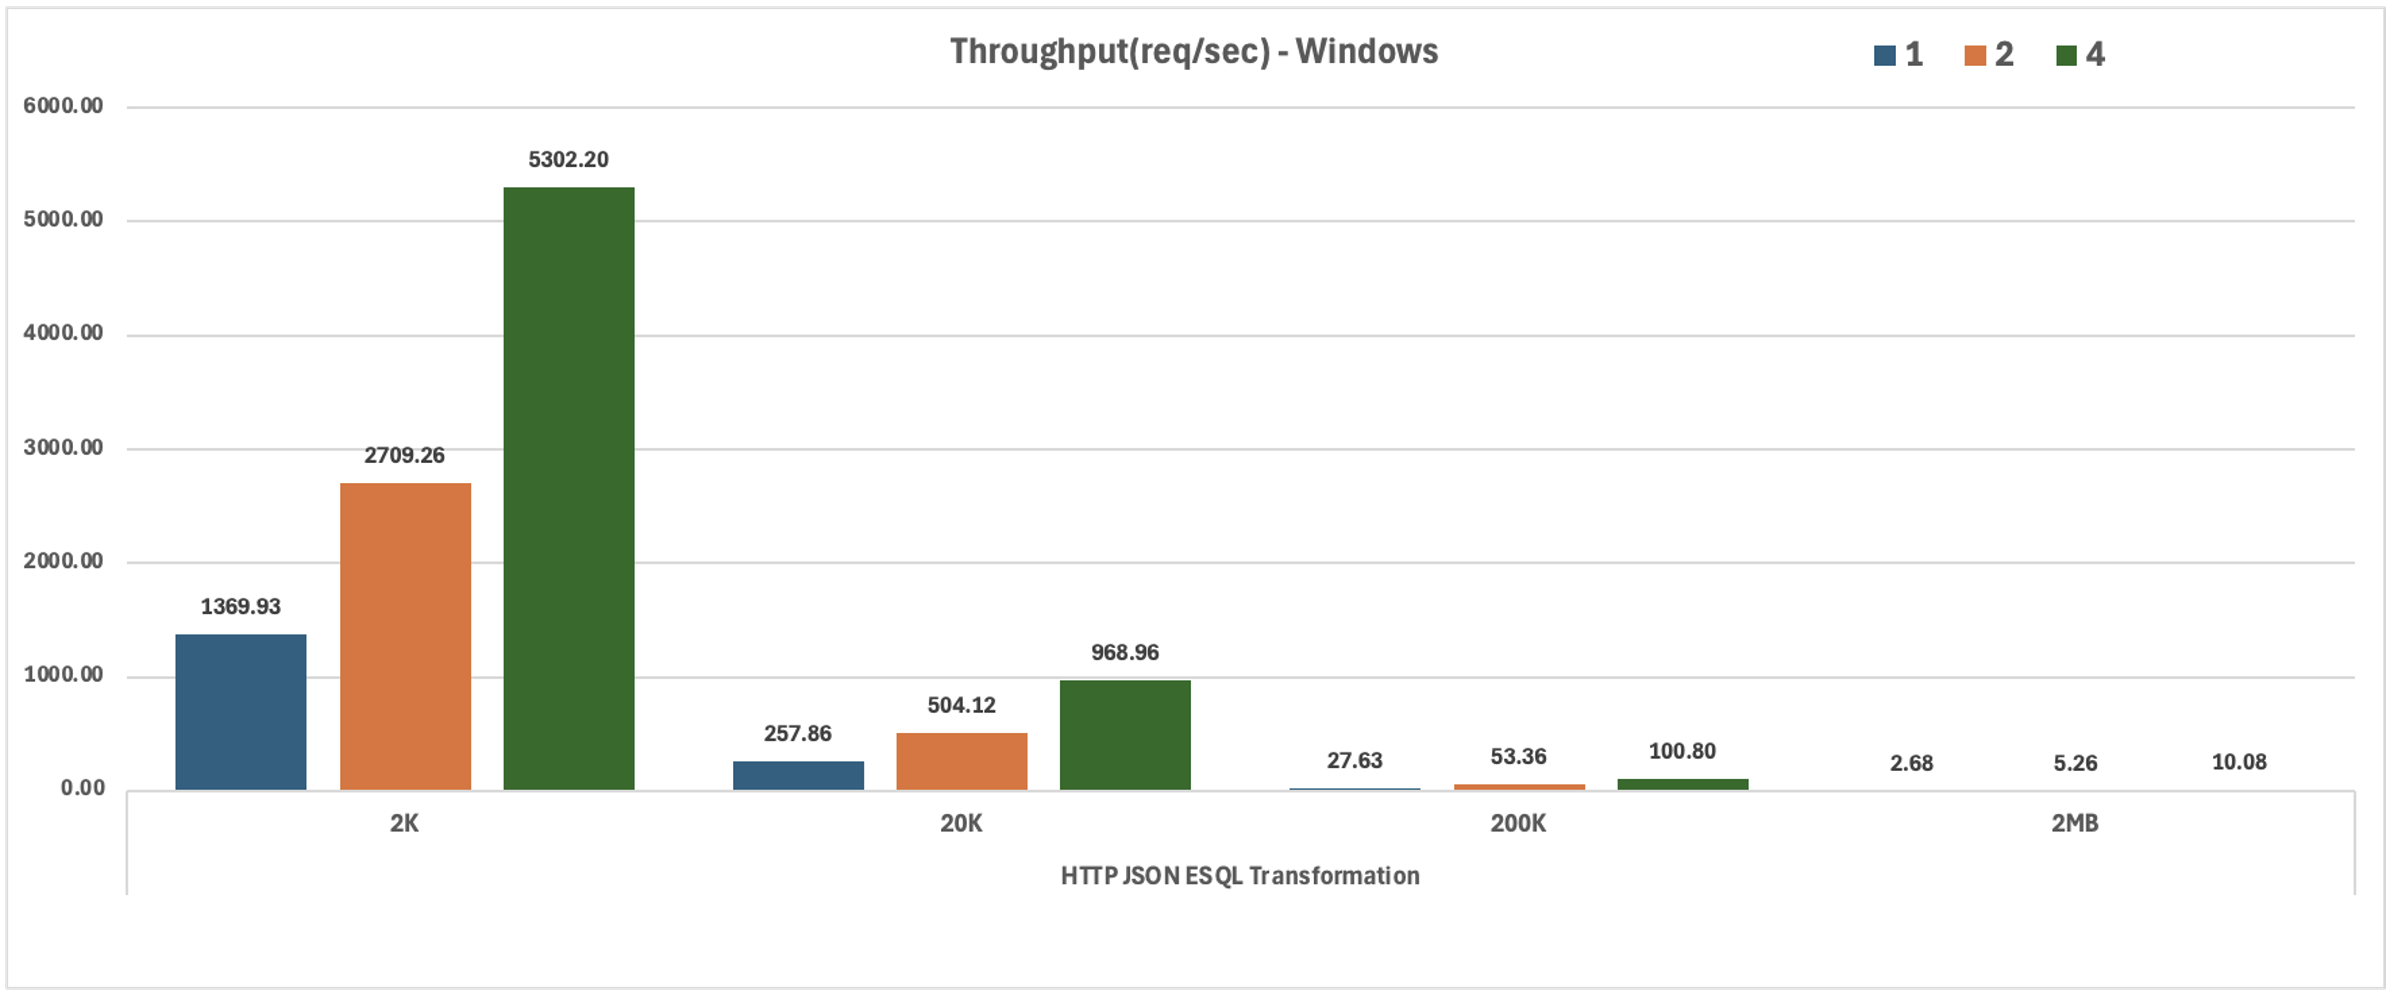
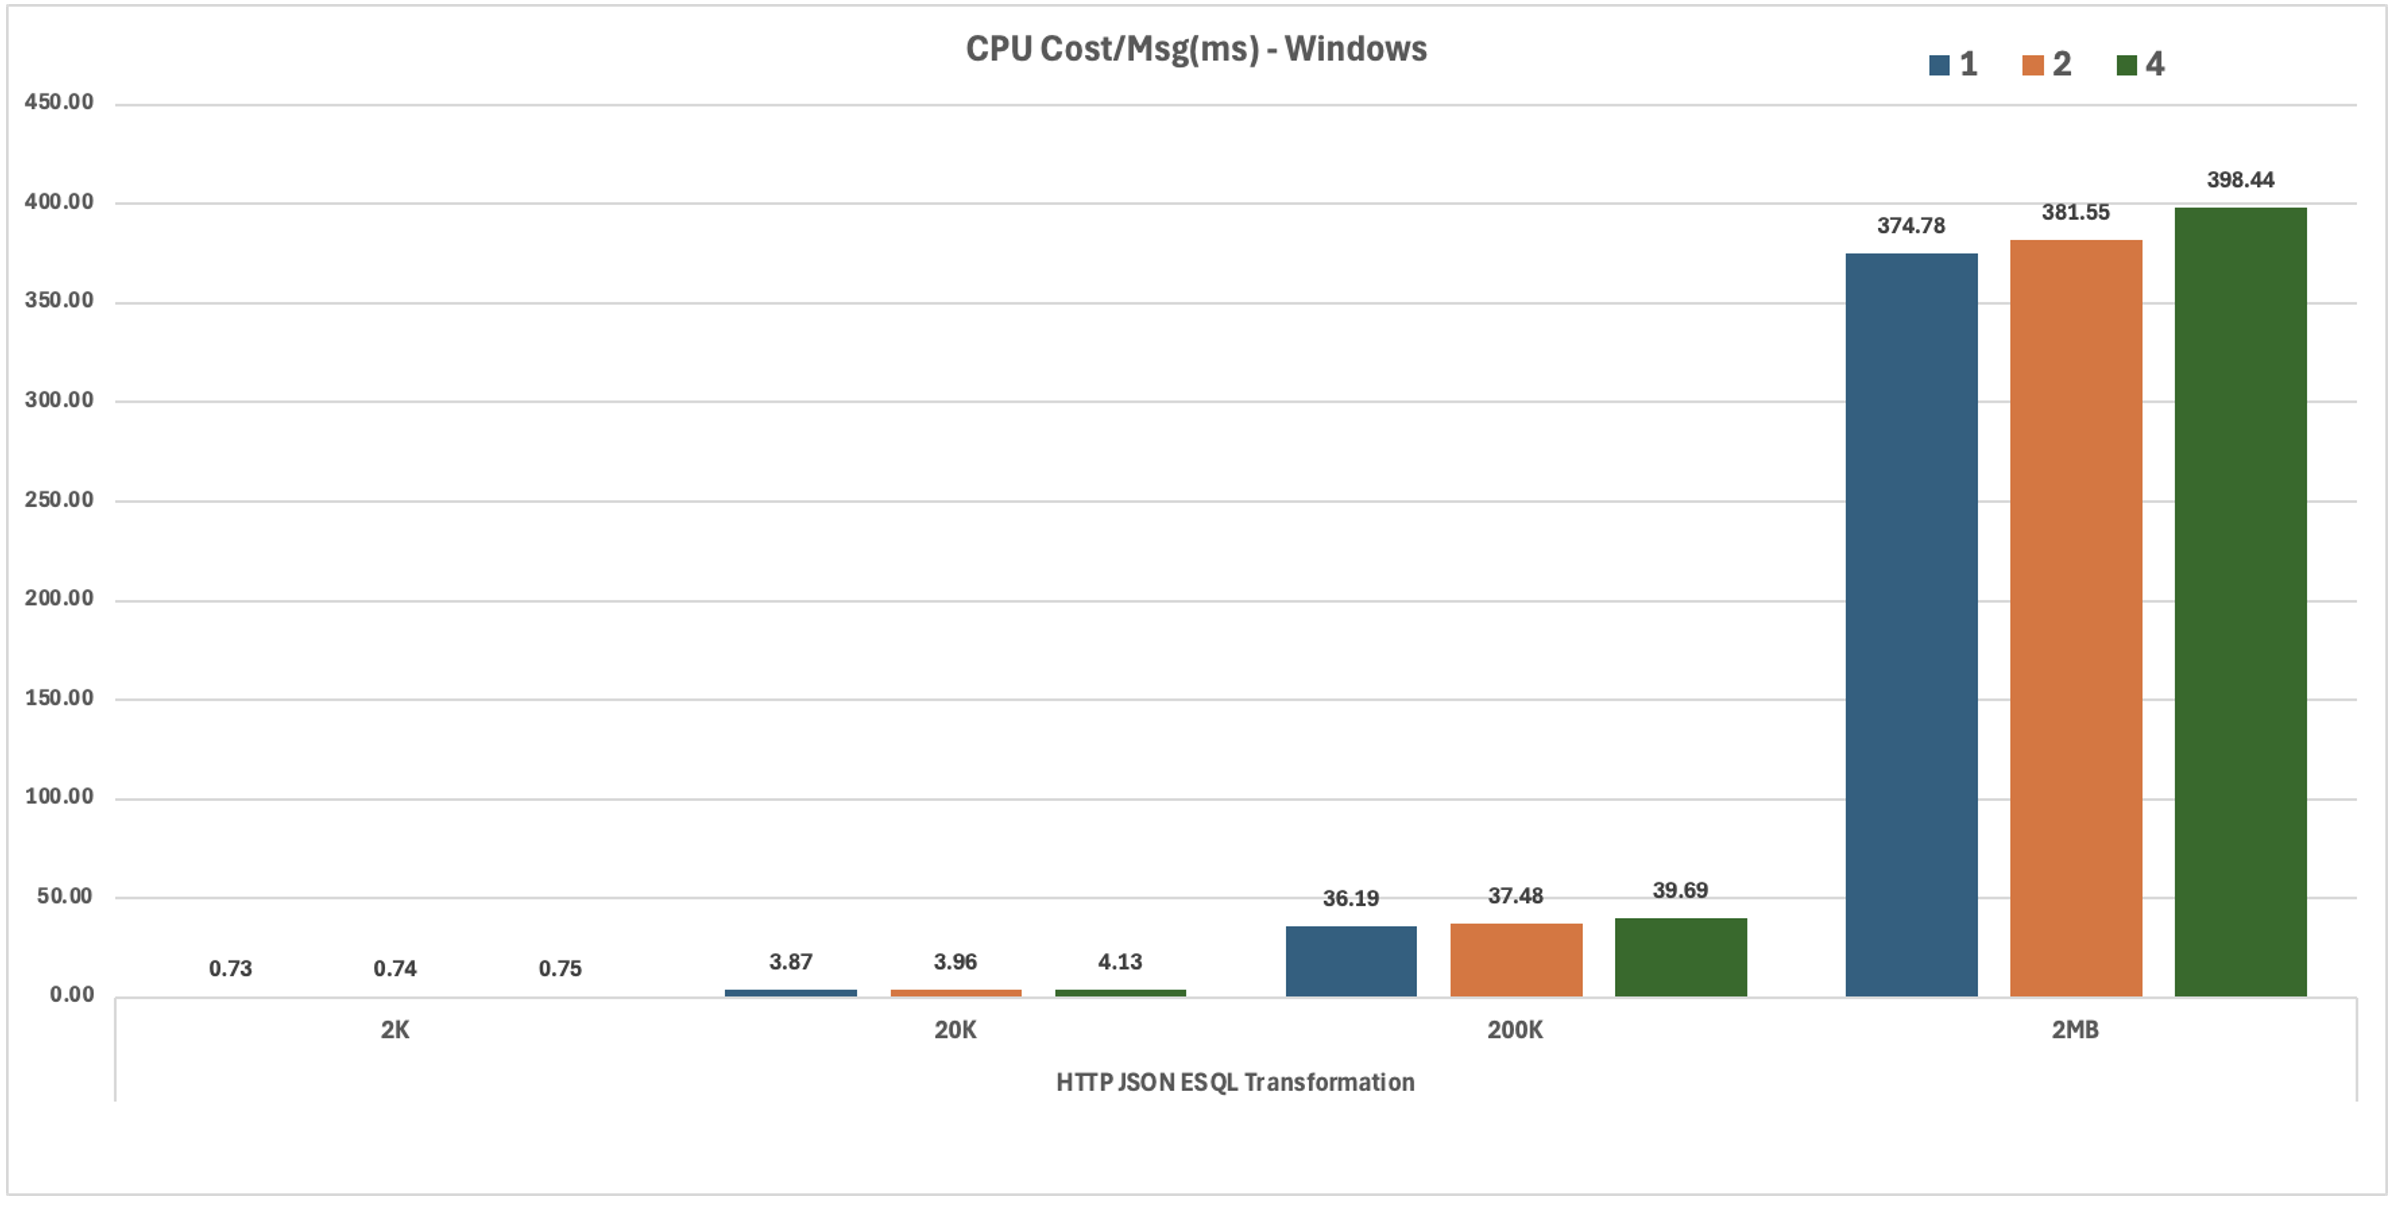
The HTTP JSON ESQL Transformation test case is similar to the HTTP XMLNSC ESQL Transformation scenario, except that it uses a JSON input message. The ESQL compute node performs a simple operation on the message body where it parses the incoming message and adds up the numeric values scattered throughout the message and writes the sum in the JSON response message. This test case evaluates the performance of a combination of HTTP transport, parsing, serialization, and ESQL transformation in the JSON domain.
MQ Aggregation







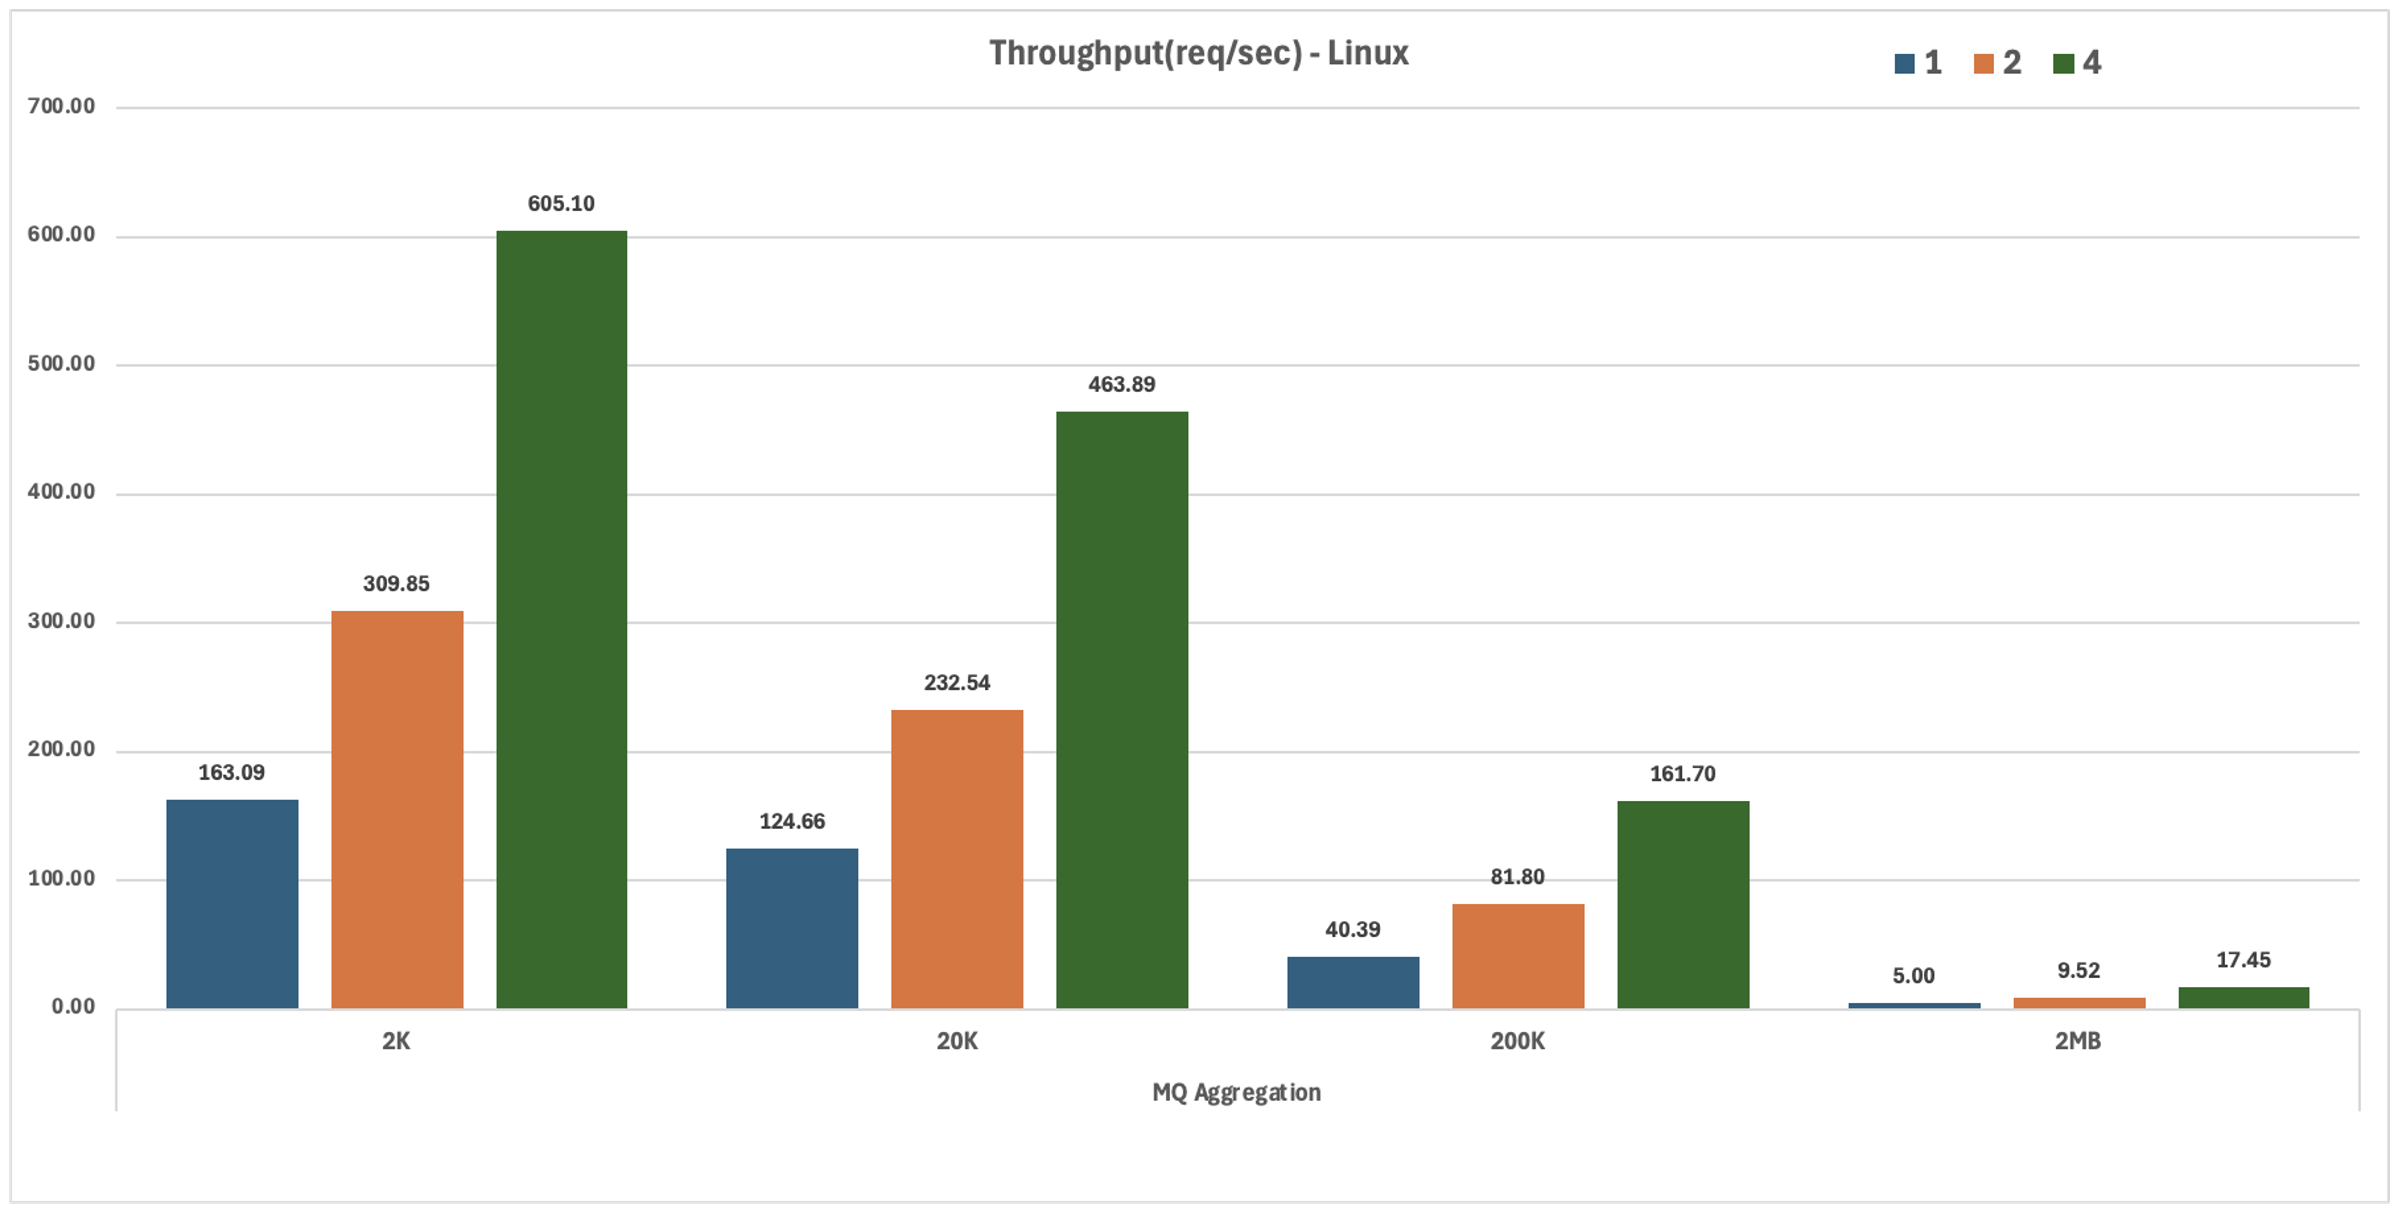
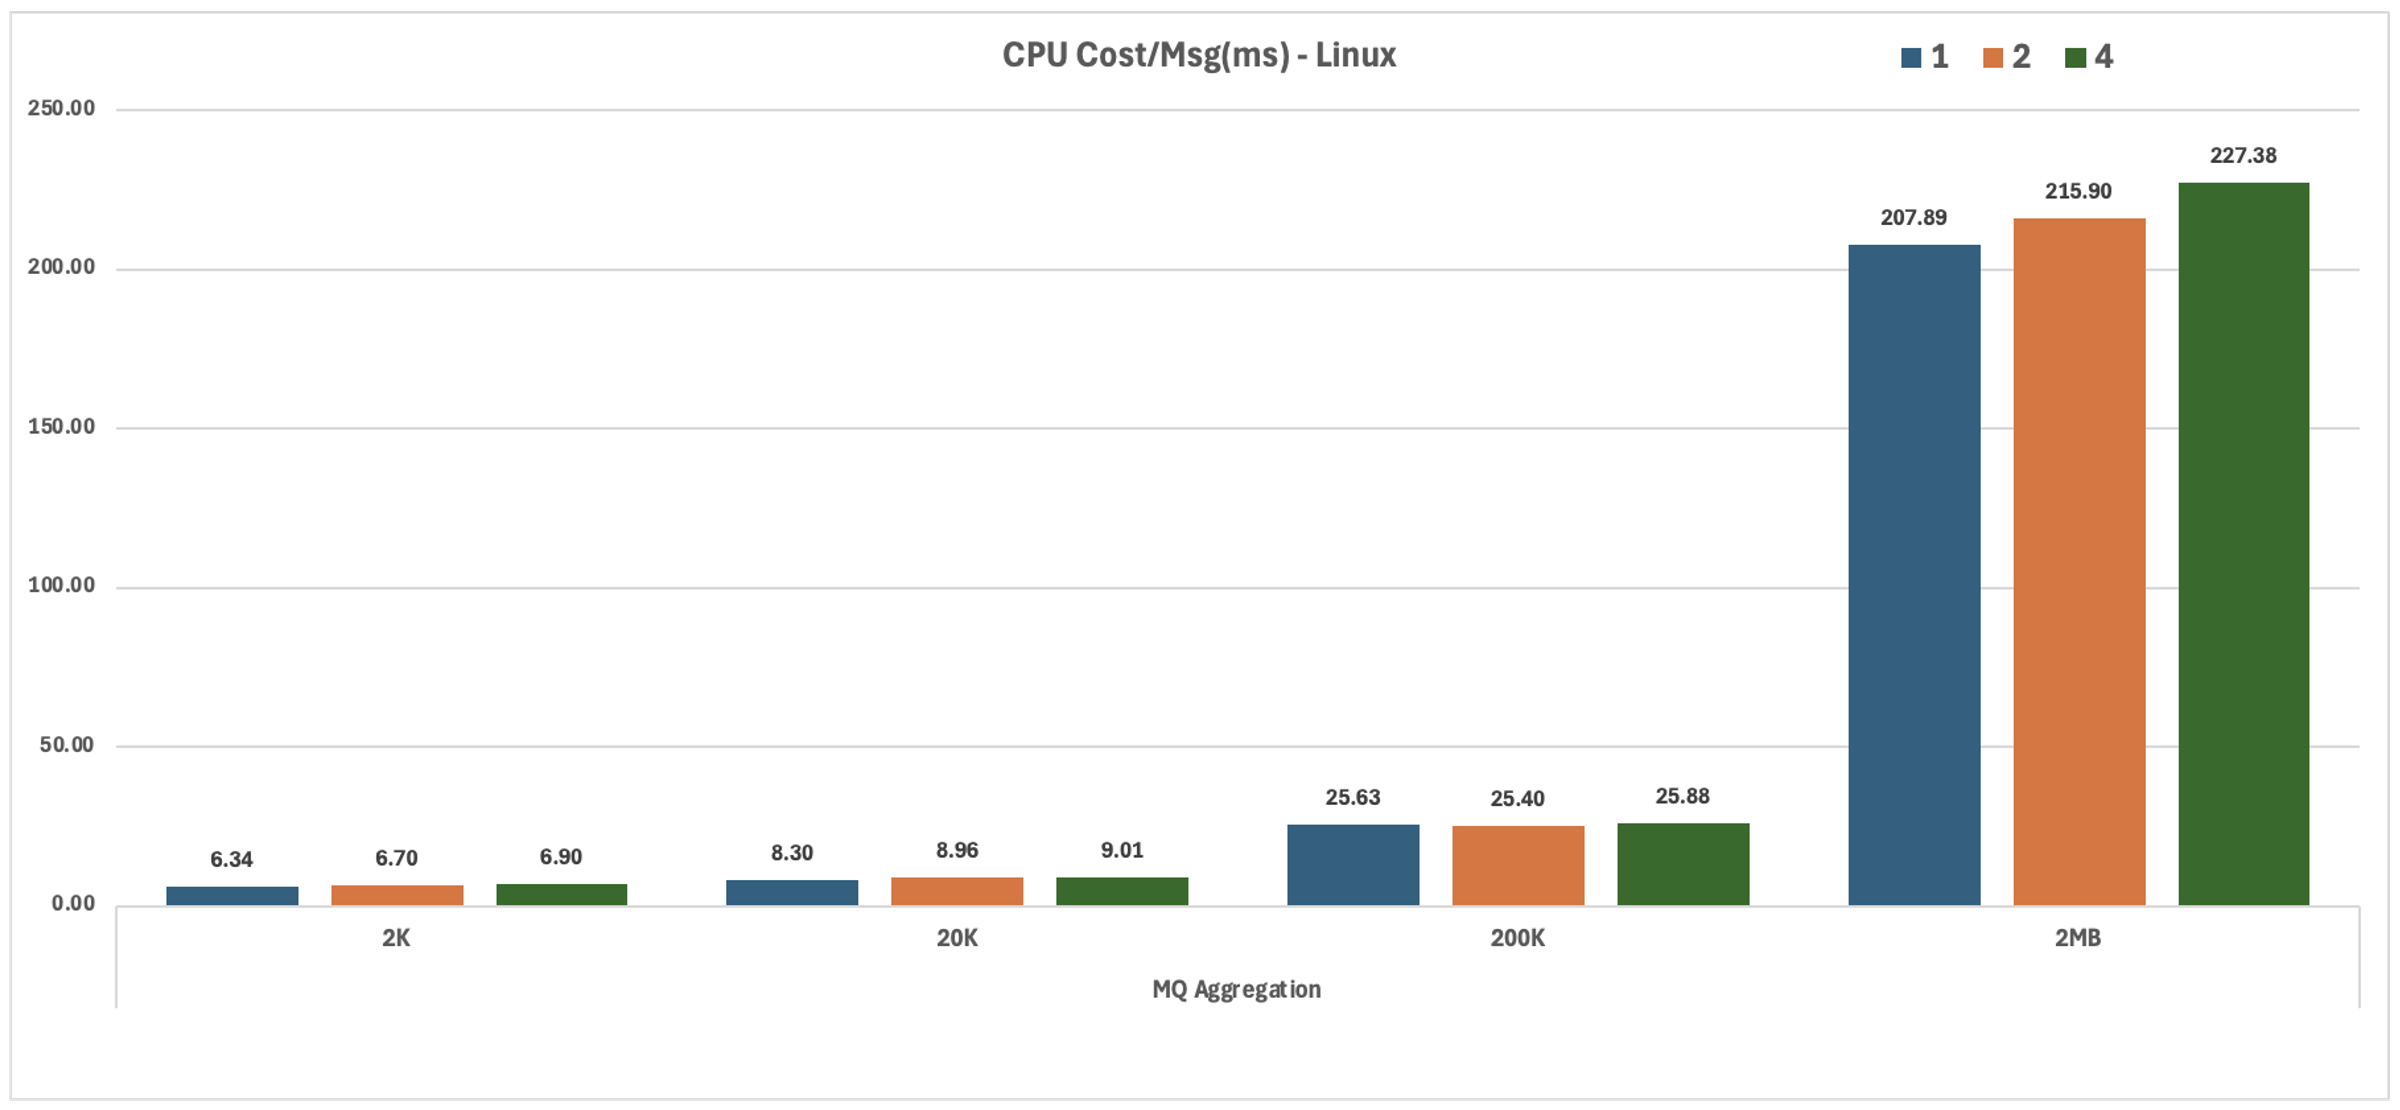














The MQ Aggregation test case is based closely on the “Aggregation nodes using MQ nodes with back-end services”. This test case evaluates the performance of a message flow that receives an MQ message, and fans-out two separate MQ request messages (after simple transformations using a Mapping node). There are separate back-end message flows which read these MQ requests and reply to a common response queue. Finally, a separate fan-in message flow aggregates the two response messages.
This flow handles the incoming XML message from the input queue, transforms it and sends the resulting messages to two different queues.
The two back-end flows as shown above read the requests, transform them using a simple Mapping node and send the resulting messages to a common backend queue.
The fan-in message flow shown above aggregates the two response messages and sends the final aggregated message to the output queue.
The MQ Coordinated Request-Reply test case, based closely on the Coordinated Request Reply WebSphere MQ sample, consists of three message flows; it exercises the MQ Input, MQ Output, MQ Get, and MQ Reply nodes, manipulates MQMD headers, and performs transformation and parsing in the XMLNSC and MRM domains.
The Request flow handles XML messages arriving at a designated input queue, saving the original MQMD header to a designated store queue, transforming the payload to a different representation, and changing the ReplyToQ field in the MQMD header to a designated internal back-end reply queue before forwarding the message to the internal back-end request queue.
The Back-End flow receives the message transformed by the Request flow via its internal input queue, adds a timestamp to the message body and places the result on an internal queue referred to by the now updated ReplyToQ field of the MQMD header.
Finally, the Reply flow transforms the reply generated by the Back-End flow back to its original XML-based representation, restores its original MQMD header from the internal store queue, and returns the result to the Reply-To Queue designated in the original request sent by the external client.
Note that the original sample has been slightly modified to better fit PerfHarness’s message correlation model, hence the additional SetMQMDReport compute node in the Reply flow, and an additional ESQL statement in the compute node of the Back-End flow. These additional statements update the Report field of the MQMD header to preserve both the Message Id and the Correlation Id.
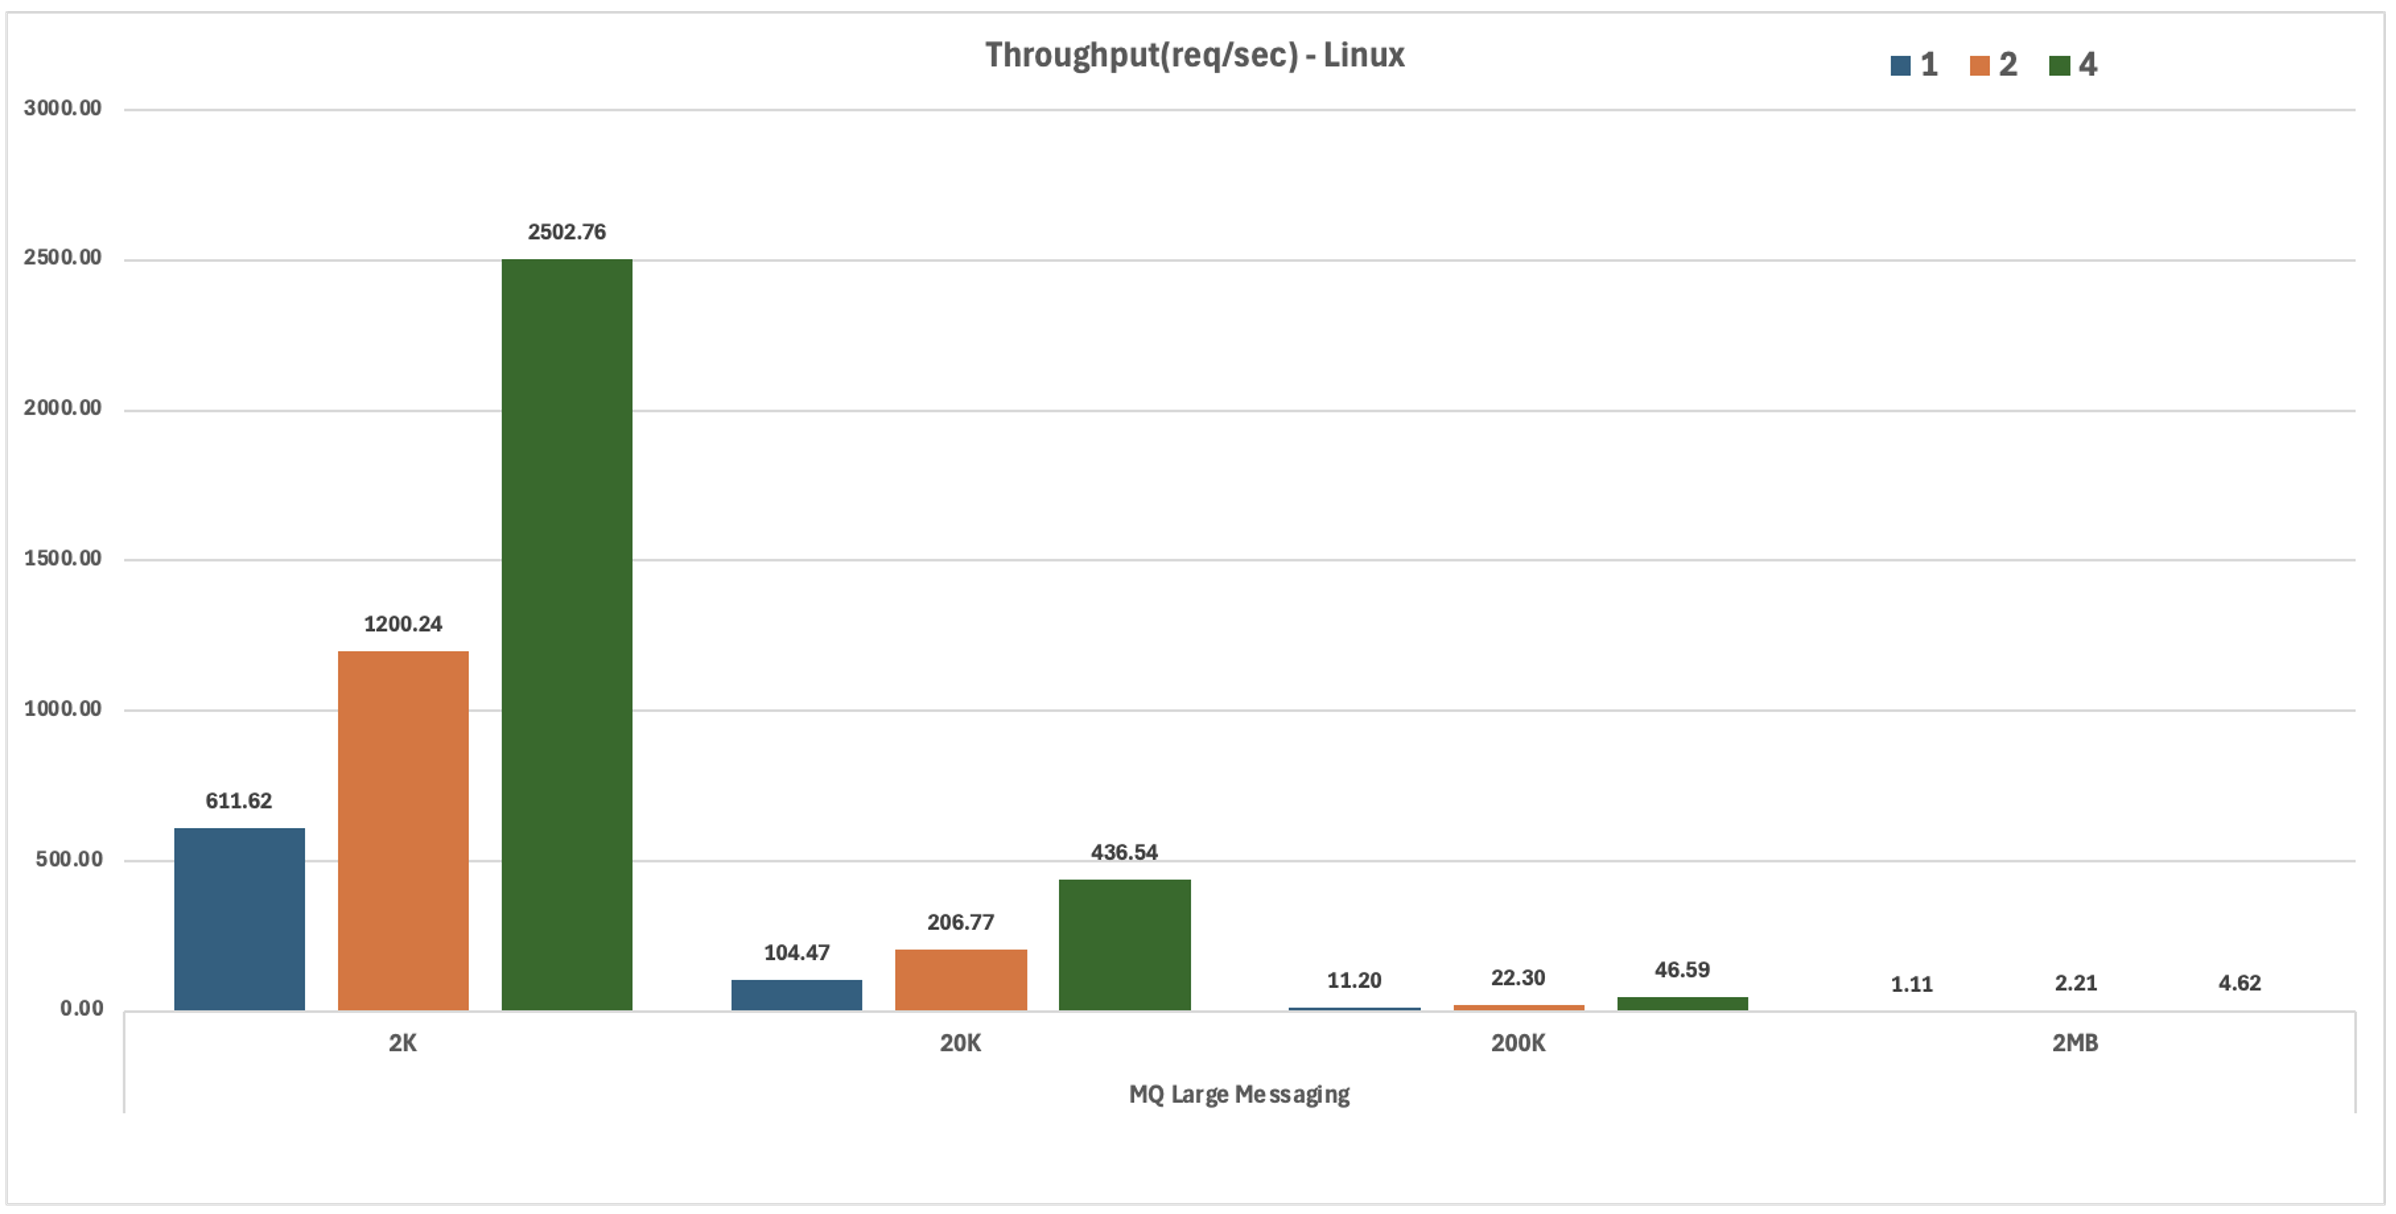
The MQ Large Messaging test case is based closely on the Large Messaging sample. It performs message transformation in the XMLNSC domain using an ESQL compute node, interacting with the external world via MQ. Input messages contain a repeating XML structure, whose individual elements are extracted and are forwarded as separate MQ messages to a designated output queue.
For the purposes of performance testing, two PerfHarness instances: a primary instance to send the input message to the application’s input queue (handled by the MessageWithRepeatingElements node) and wait for an indication (placed by the MessageSlicingComplete node) on another queue that the message has been completely processed, and a secondary instance to retrieve the resulting message slices (output by the RepeatedElementSlices node) from another queue. This way the primary PerfHarness instance can maintain a one-to-one correspondence between requests and responses and produce a message throughput metric suitable for evaluating and comparing system performance.
In line with the other tests, the input messages used are the 2K, 20K, 200K and 2MB sizes and contain 2, 20, and 200, 2000 records each, respectively. This means that for example the 200K message, 200 slices will be placed on the output queue for each input message, resulting in a message throughput on the slice output queue of 200 times the throughput on the request-response queue pair. In this document, the message throughput seen by the primary PerfHarness instance is reported.
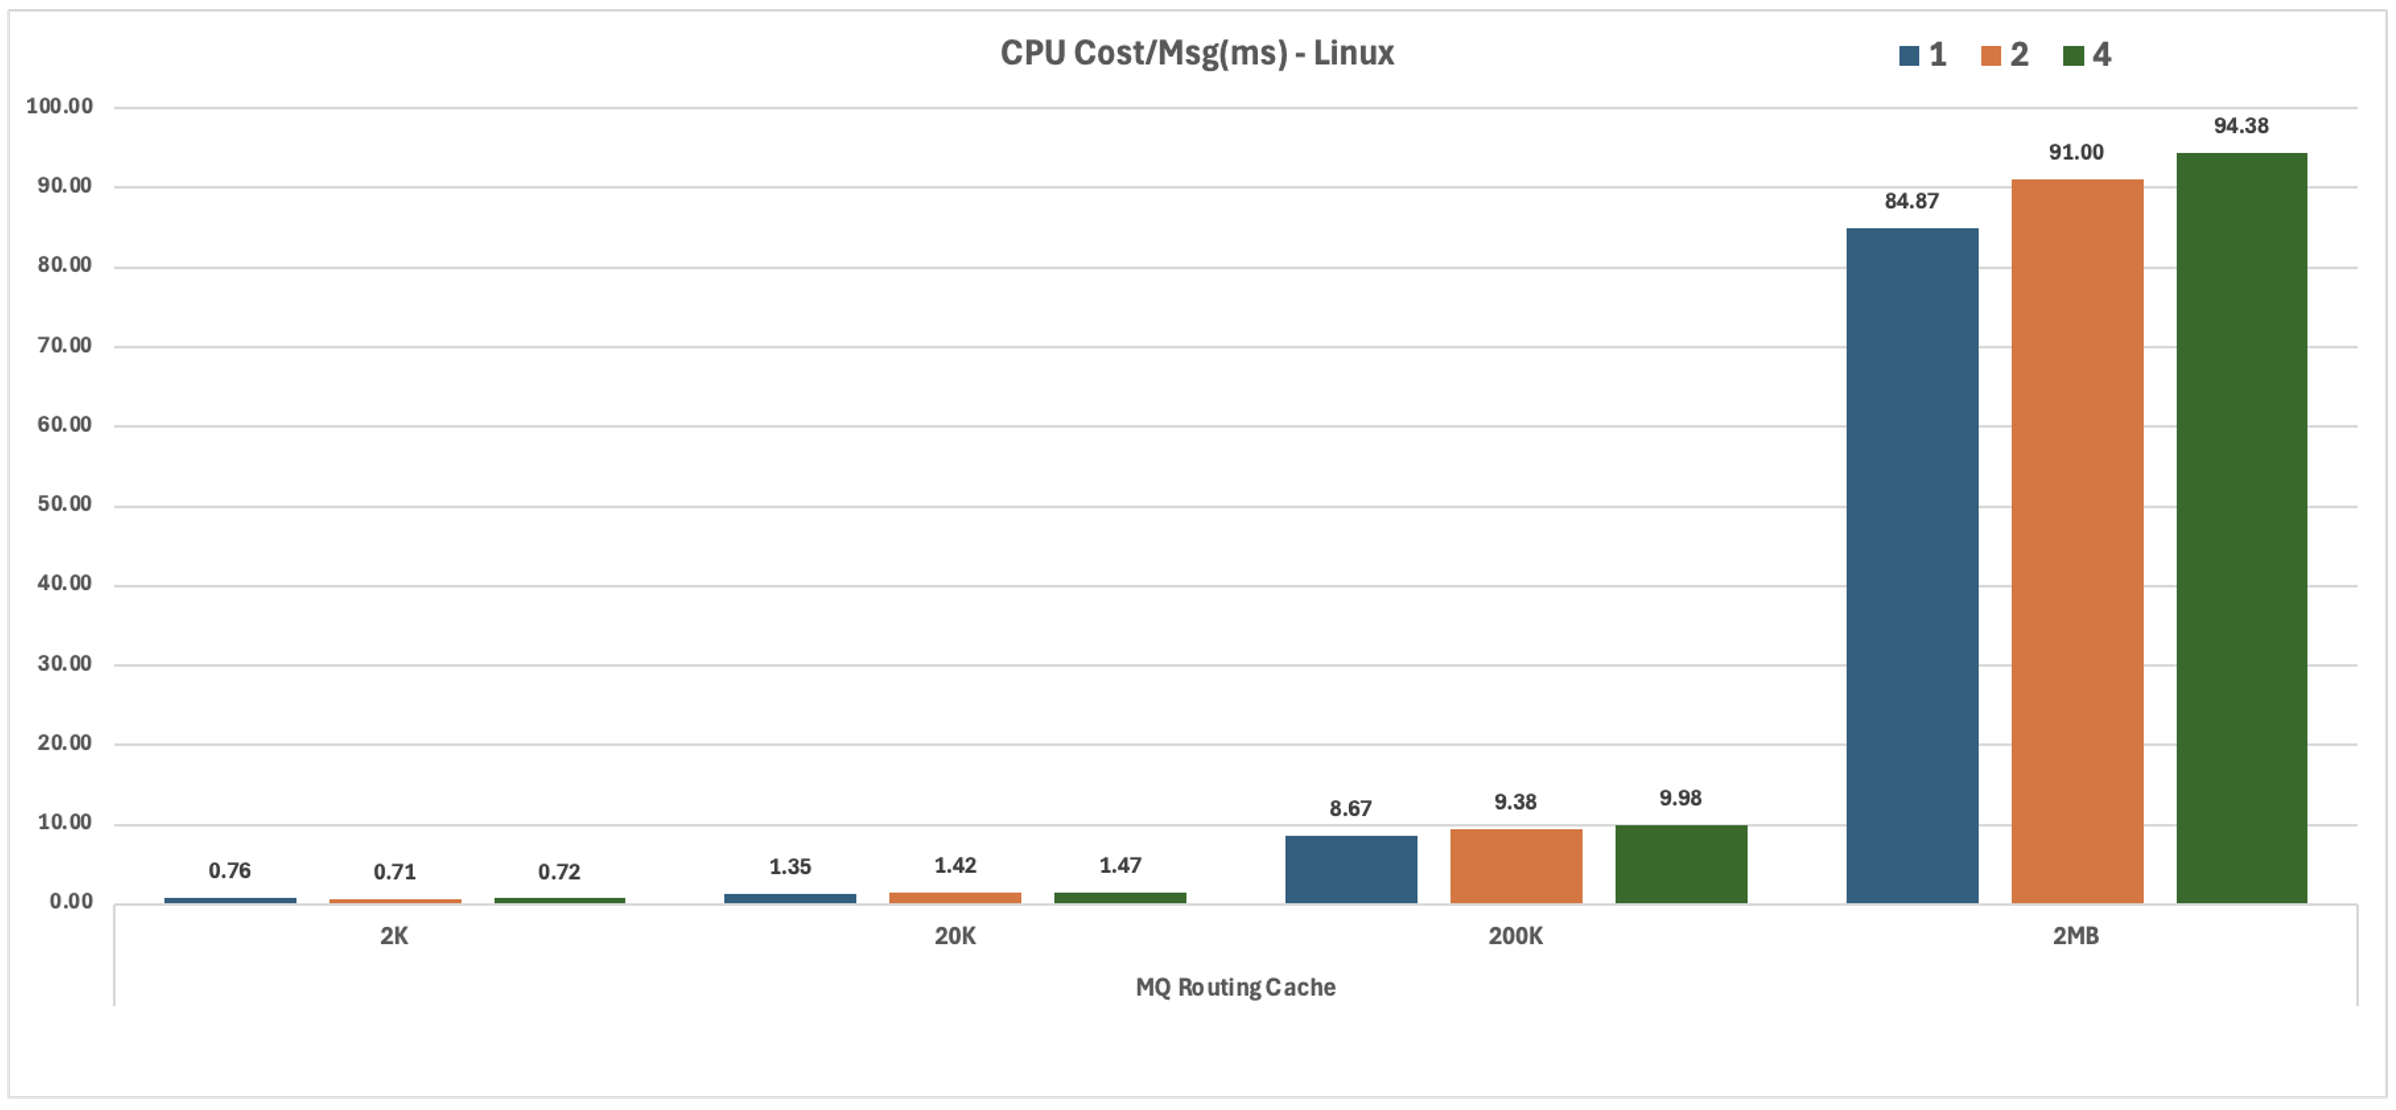
The MQ Routing Cache test case, based closely on the Message Routing sample, exercises a dynamic routing scenario where a field from the input message is extracted and used to look up the name of a destination. In this test there is a hardcoded list of all possible destinations that is cached in an ESQL SHARED ROW. A destination is then looked up in the cache to get a destination name for subsequent messages. The test exercises the MQ-based transport, XMLNSC parsing, and dynamic routing.
This flow performs the above dynamic routing scenario that is being tested for performance.
Note that the source of the destination could be an SQL Database (like IBM DB2) as well.
However, since in this test the lookup is anyways cached in memory, instead of doing a database lookup, it was decided to store the destination names in the code and data structures of the message flow for simplicity reasons.
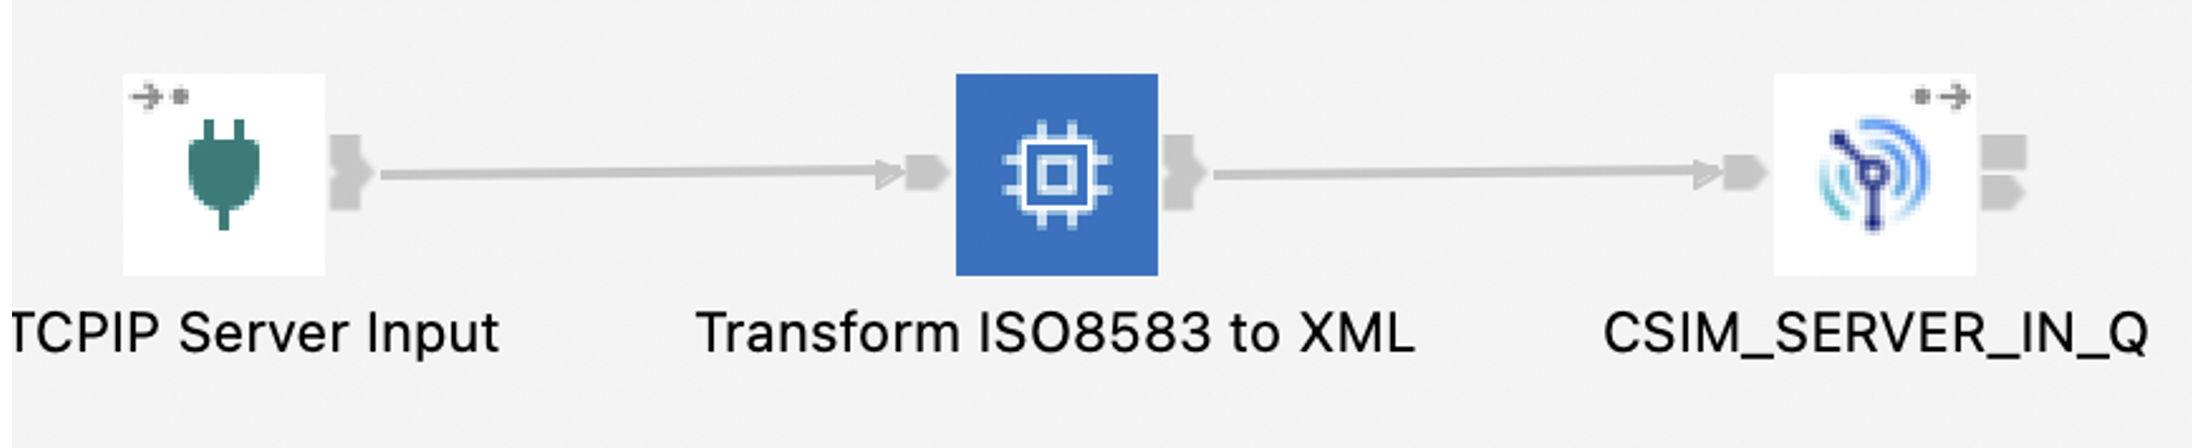
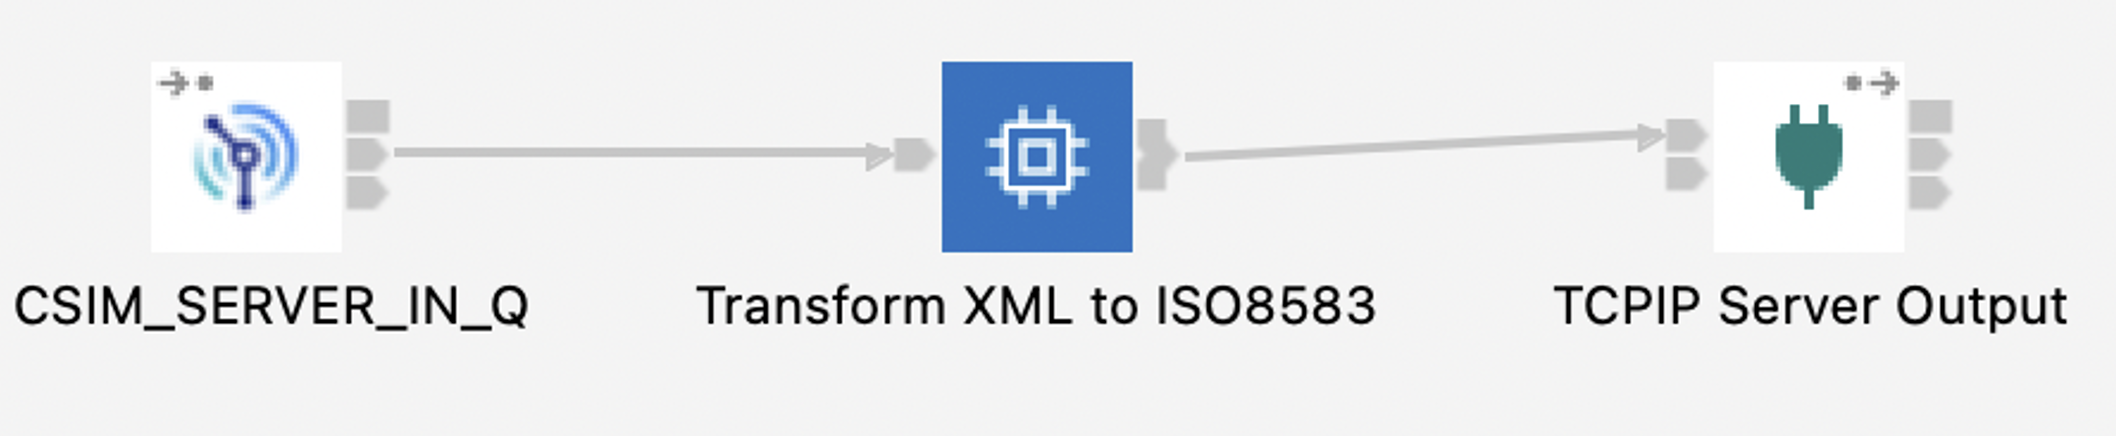
The TCPIP ISO8853 XML Transformation test case uses the TCPIP Protocol as the transport protocol and processes message in a binary ISO8583 and XML format.
A message in a binary format (ISO8583) is received by a TCPIP Server Input node when it is then converted to an XML equivalent format. The transformed message is then written to an MQ queue where it is then read in by a second message flow. This second message flow converts the incoming message from XML to a binary (ISO8583) format and the message is sent to the original requesting client using a TCPIP Server Output node.
The first message flow which receives the incoming message in a binary format is shown below.
The second message flow which reads from an MQ queue and converts the XML message to a binary (ISO8583) format is show below.
This test is evaluated only for a single message size of around 1.3KB. The PerfHarness TCPIPRequestor module is used to send messages to and from the TCPIP Server.
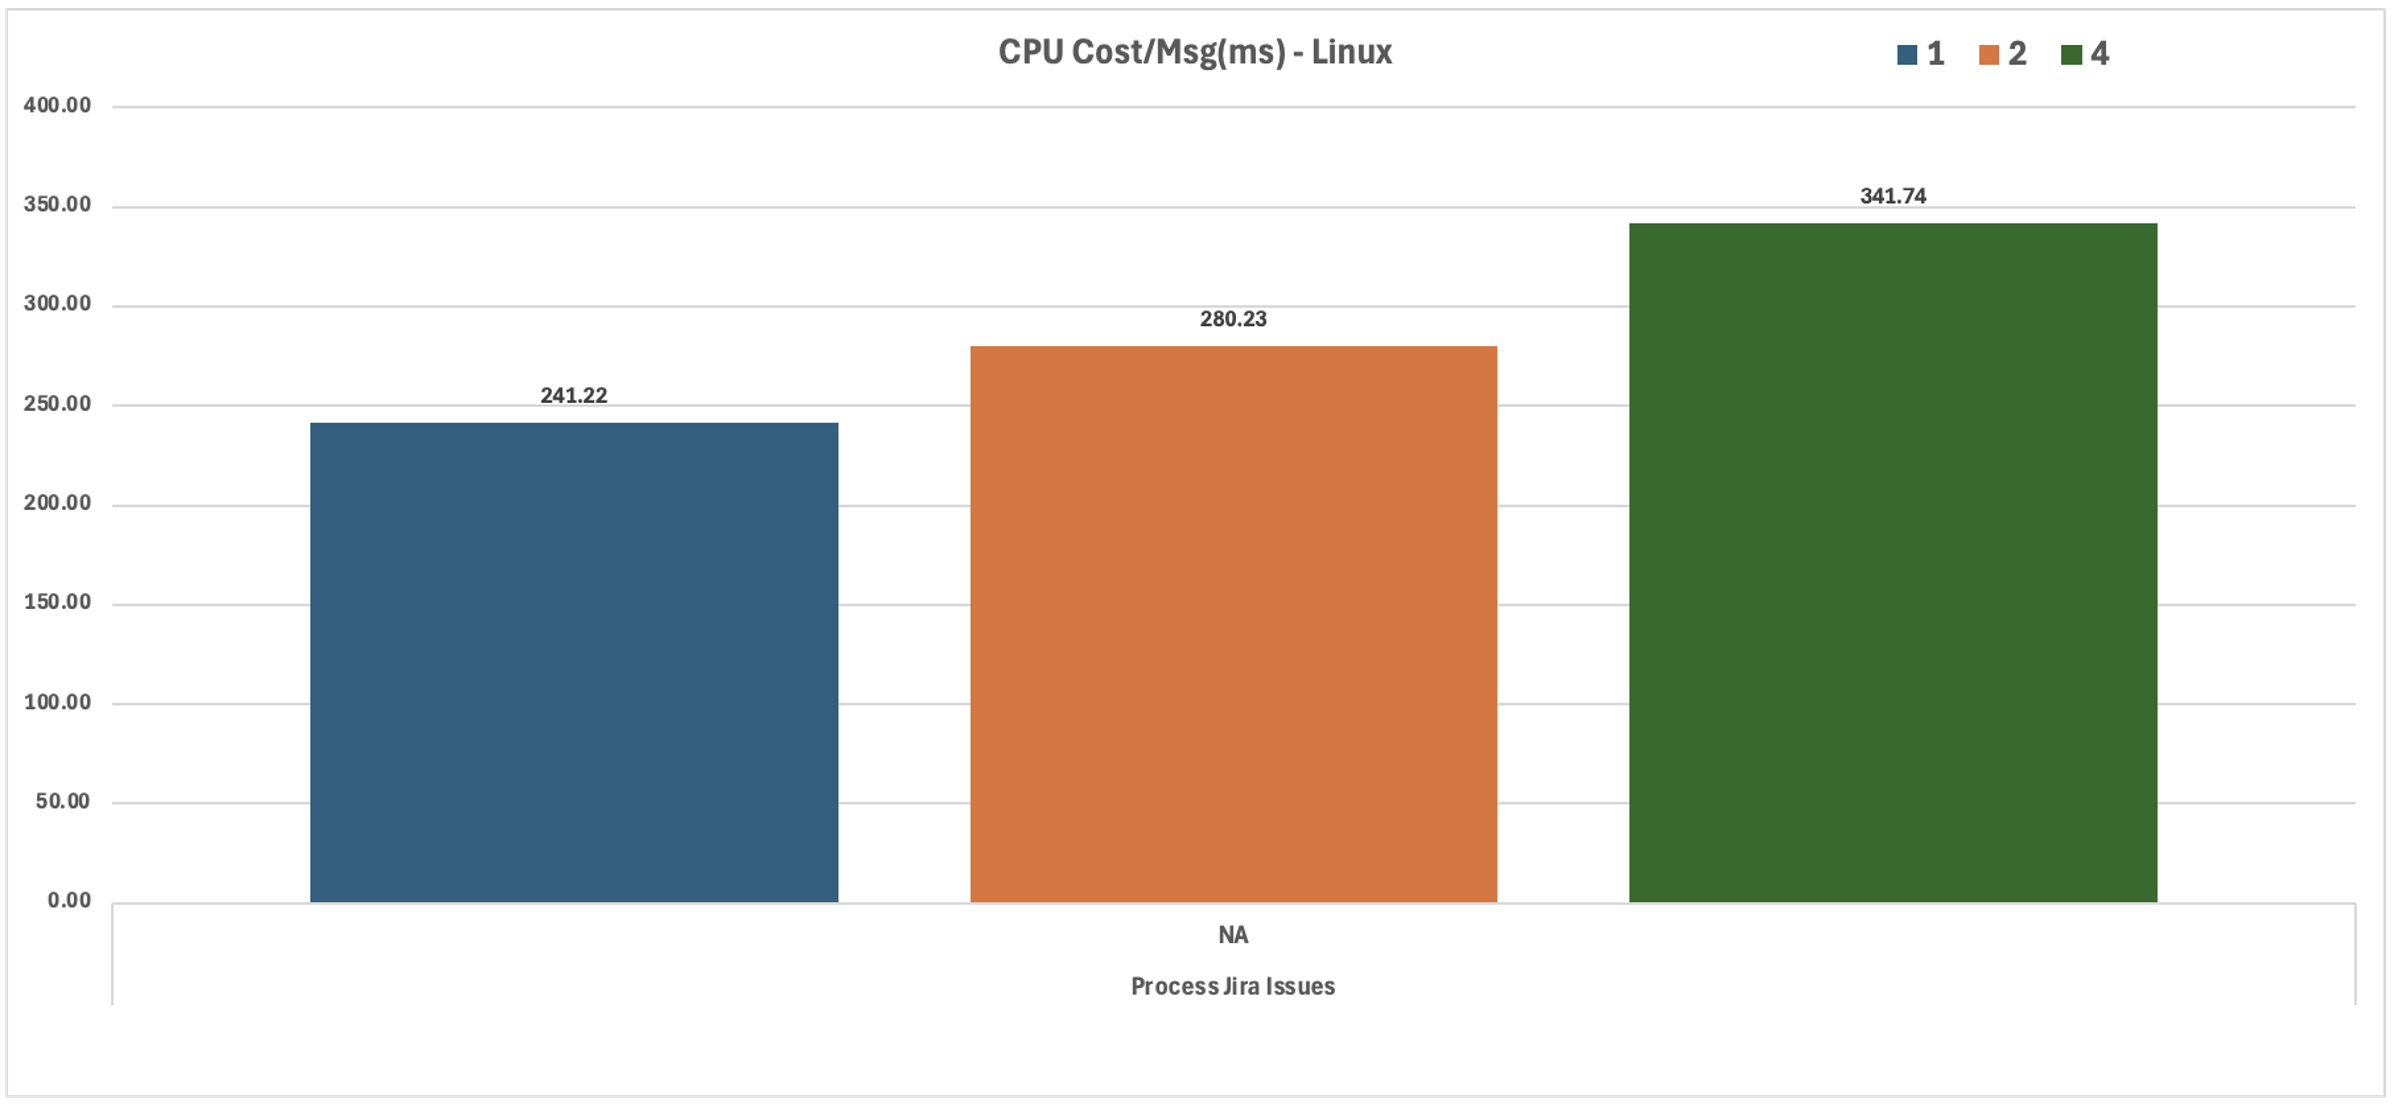
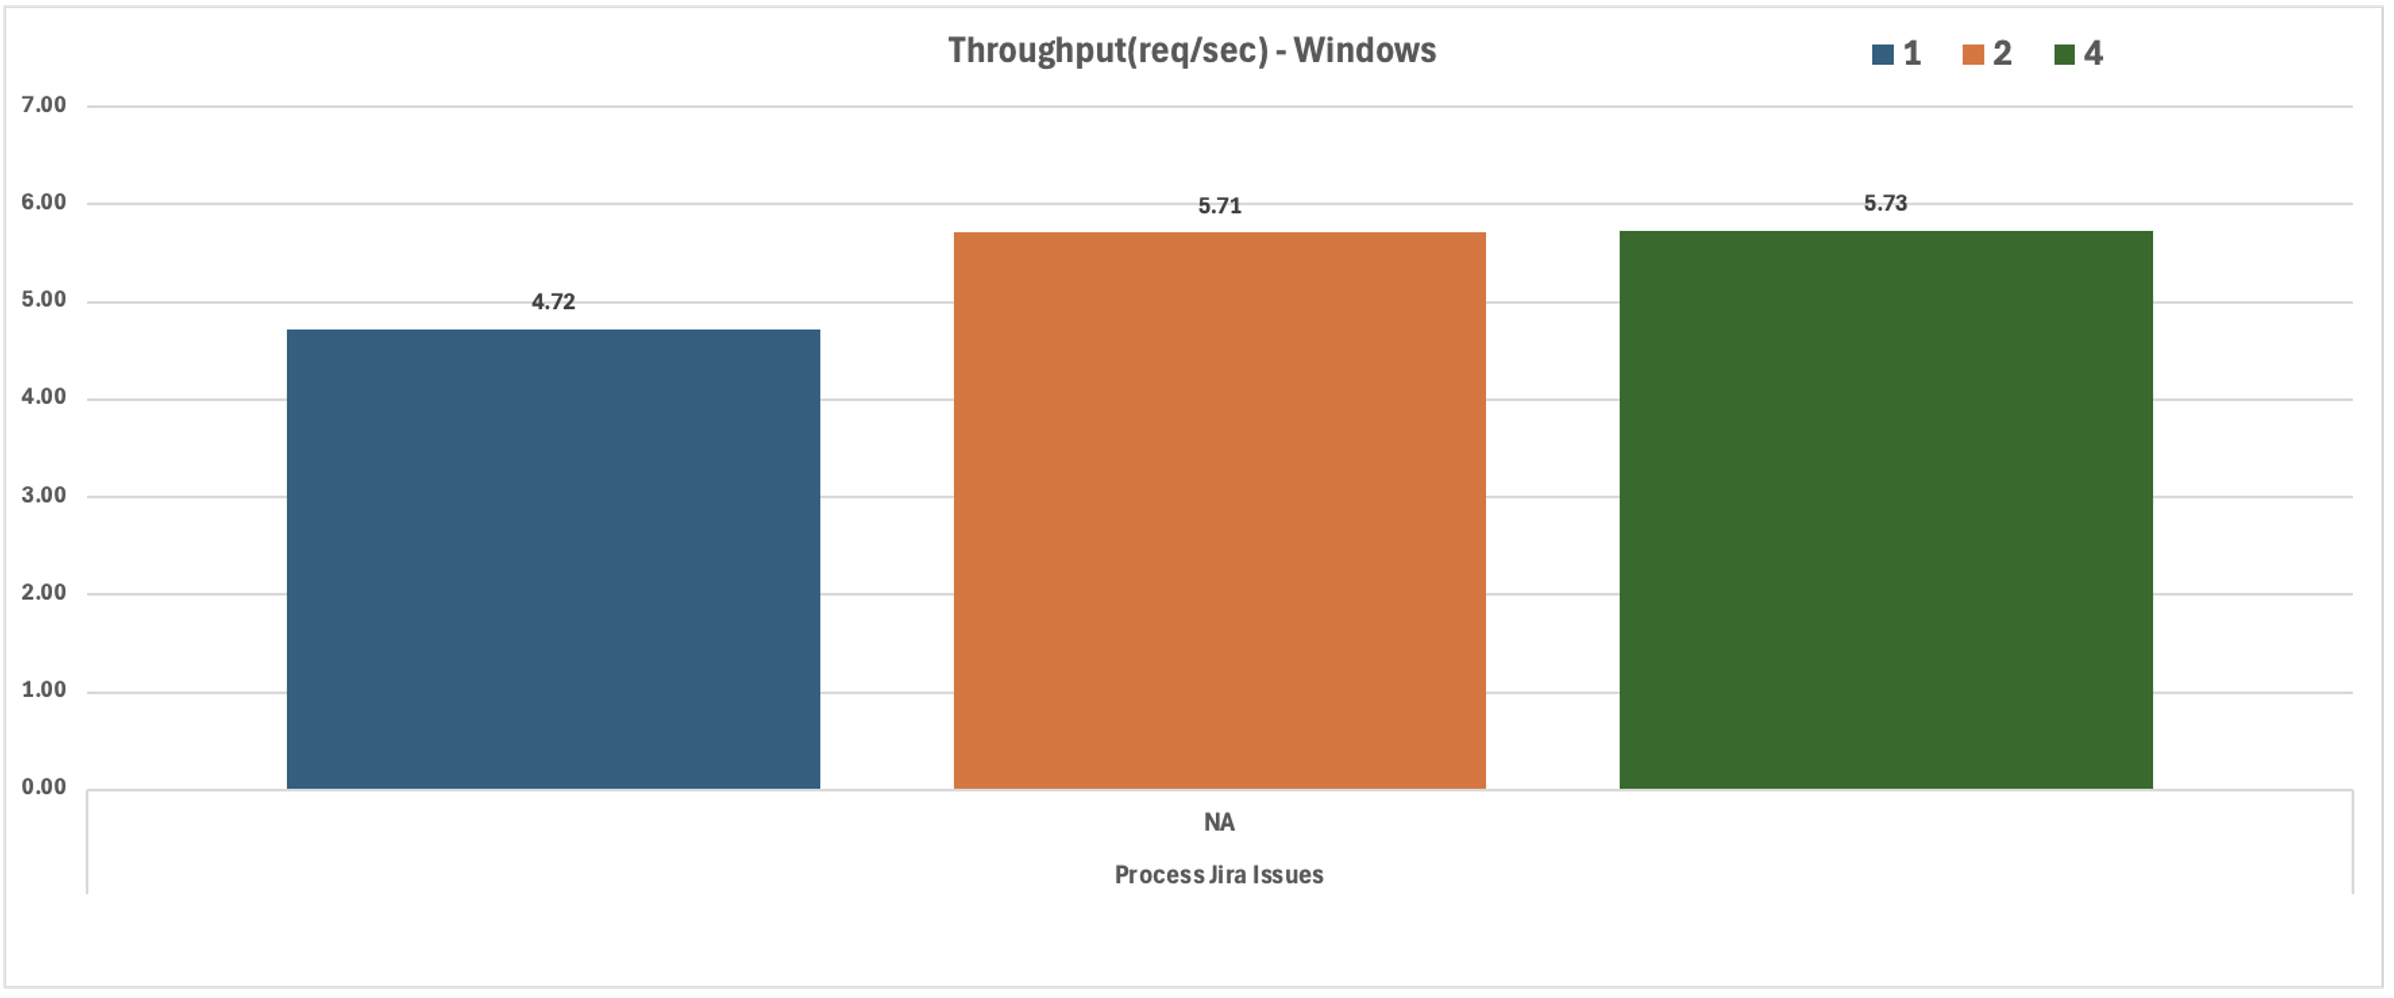
The Process Jira Issues test case evaluates a flow created in the Toolkit, with the Jira Connector node. In this case, the “Jira Issues” are processed in the integration flow.
As shown in the figure above, when the flow starts, 10 Jira Issues are retrieved at a time using a Jira Request node. The following compute node loops over and processes each of these 10 issues. To initiate the message flow an HTTP request is made to the processing server. Finally when all the processing is done, a simple response is returned back.
The request to Jira from the Jira Request node is intercepted using a “Mock Server” which serves the 10 Jira Issues. Similarly, a hosted HTTP Server is used to process each Issue.
The purpose of this test is to evaluate a scenario with a retrieve action on a connector node as well as the iterating over the result set.
The Create ServiceNow Incidents test case evaluates a Toolkit flow with the ServiceNow Connector node. In this case “ServiceNow Incidents” are created in an integration flow.
As shown in the figure above, when the flow starts, an ESQL Compute node is used to loop over the incoming data and creates two ServiceNow Incidents that are posted to a ServiceNow instance.
The request to ServiceNow is intercepted using a “Mock Server”, which processes the Create ServiceNow Incident action and delivers a response to the message flow.
Find here the numerical results of the tests for the three platforms they were run on.
| Message Size | Concurrency | Throughput (req/s) | CPU Cost/Msg (ms) |
|---|---|---|---|
| 2K | 1 | 1209.57 | 0.80 |
| 2K | 2 | 2166.83 | 0.85 |
| 2K | 4 | 4128.32 | 0.86 |
| 20K | 1 | 262.77 | 3.75 |
| 20K | 2 | 488.59 | 4.01 |
| 20K | 4 | 913.23 | 4.23 |
| 200K | 1 | 28.05 | 35.25 |
| 200K | 2 | 50.62 | 39.10 |
| 200K | 4 | 96.08 | 41.36 |
| 2MB | 1 | 2.71 | 367.50 |
| 2MB | 2 | 5.04 | 395.33 |
| 2MB | 4 | 9.54 | 418.85 |
| Message Size | Concurrency | Throughput (req/s) | CPU Cost/Msg (ms) |
|---|---|---|---|
| 2K | 1 | 1207.91 | 0.80 |
| 2K | 2 | 2151.74 | 0.86 |
| 2K | 4 | 4109.30 | 0.86 |
| 20K | 1 | 239.72 | 4.11 |
| 20K | 2 | 448.24 | 4.38 |
| 20K | 4 | 850.43 | 4.55 |
| 200K | 1 | 25.37 | 38.96 |
| 200K | 2 | 46.02 | 43.02 |
| 200K | 4 | 88.06 | 45.13 |
| 2MB | 1 | 2.47 | 403.65 |
| 2MB | 2 | 4.56 | 436.94 |
| 2MB | 4 | 8.82 | 453.47 |
| Message Size | Concurrency | Throughput (req/s) | CPU Cost/Msg (ms) |
|---|---|---|---|
| 2K | 1 | 163.09 | 6.34 |
| 2K | 2 | 309.85 | 6.70 |
| 2K | 4 | 605.10 | 6.90 |
| 20K | 1 | 124.66 | 8.30 |
| 20K | 2 | 232.54 | 8.96 |
| 20K | 4 | 463.89 | 9.01 |
| 200K | 1 | 40.39 | 25.63 |
| 200K | 2 | 81.80 | 25.40 |
| 200K | 4 | 161.70 | 25.88 |
| 2MB | 1 | 5.00 | 207.89 |
| 2MB | 2 | 9.52 | 215.90 |
| 2MB | 4 | 17.45 | 227.38 |
| Message Size | Concurrency | Throughput (req/s) | CPU Cost/Msg (ms) |
|---|---|---|---|
| 2K | 1 | 200.10 | 4.93 |
| 2K | 2 | 365.04 | 5.42 |
| 2K | 4 | 749.38 | 5.30 |
| 20K | 1 | 47.19 | 21.04 |
| 20K | 2 | 93.32 | 21.31 |
| 20K | 4 | 182.60 | 21.86 |
| 200K | 1 | 5.43 | 183.15 |
| 200K | 2 | 10.56 | 188.01 |
| 200K | 4 | 21.68 | 182.75 |
| 2MB | 1 | 0.54 | 1856.64 |
| 2MB | 2 | 0.98 | 2023.87 |
| 2MB | 4 | 2.00 | 1937.69 |
| Message Size | Concurrency | Throughput (req/s) | CPU Cost/Msg (ms) |
|---|---|---|---|
| 2K | 1 | 611.62 | 1.57 |
| 2K | 2 | 1200.24 | 1.60 |
| 2K | 4 | 2502.76 | 1.55 |
| 20K | 1 | 104.47 | 9.14 |
| 20K | 2 | 206.77 | 9.32 |
| 20K | 4 | 436.54 | 8.95 |
| 200K | 1 | 11.20 | 85.26 |
| 200K | 2 | 22.30 | 86.24 |
| 200K | 4 | 46.59 | 83.88 |
| 2MB | 1 | 1.11 | 644.94 |
| 2MB | 2 | 2.21 | 656.11 |
| 2MB | 4 | 4.62 | 634.31 |
| Message Size | Concurrency | Throughput (req/s) | CPU Cost/Msg (ms) |
|---|---|---|---|
| 2K | 1 | 1284.41 | 0.76 |
| 2K | 2 | 2732.46 | 0.71 |
| 2K | 4 | 5471.28 | 0.72 |
| 20K | 1 | 720.77 | 1.35 |
| 20K | 2 | 1377.68 | 1.42 |
| 20K | 4 | 2671.30 | 1.47 |
| 200K | 1 | 113.95 | 8.67 |
| 200K | 2 | 209.19 | 9.38 |
| 200K | 4 | 397.11 | 9.98 |
| 2MB | 1 | 11.66 | 84.87 |
| 2MB | 2 | 21.83 | 91.00 |
| 2MB | 4 | 42.35 | 94.38 |
| Message Size | Concurrency | Throughput (req/s) | CPU Cost/Msg (ms) |
|---|---|---|---|
| 2K | 1 | 165.89 | 5.95 |
| 2K | 2 | 314.90 | 6.27 |
| 2K | 4 | 610.72 | 6.30 |
| Concurrency | Throughput (req/s) | CPU Cost/Msg (ms) |
|---|---|---|
| 1 | 4.05 | 241.22 |
| 2 | 4.02 | 280.23 |
| 4 | 3.31 | 341.74 |
| Concurrency | Throughput (req/s) | CPU Cost/Msg (ms) |
|---|---|---|
| 1 | 1.06 | 867.50 |
| 2 | 0.99 | 1095.39 |
| 4 | 0.51 | 2253.22 |
| Message Size | Concurrency | Throughput (req/s) | CPU Cost/Msg (ms) |
|---|---|---|---|
| 2K | 1 | 2123.67 | 0.40 |
| 2K | 2 | 4102.86 | 0.40 |
| 2K | 4 | 8195.51 | 0.39 |
| 20K | 1 | 316.92 | 2.67 |
| 20K | 2 | 587.15 | 2.76 |
| 20K | 4 | 1136.49 | 2.82 |
| 200K | 1 | 31.99 | 26.35 |
| 200K | 2 | 60.95 | 26.91 |
| 200K | 4 | 113.21 | 28.46 |
| 2MB | 1 | 3.18 | 266.62 |
| 2MB | 2 | 5.93 | 277.45 |
| 2MB | 4 | 11.30 | 287.01 |
| Message Size | Concurrency | Throughput (req/s) | CPU Cost/Msg (ms) |
|---|---|---|---|
| 2K | 1 | 2136.35 | 0.40 |
| 2K | 2 | 4098.87 | 0.40 |
| 2K | 4 | 8346.12 | 0.38 |
| 20K | 1 | 311.90 | 2.73 |
| 20K | 2 | 582.71 | 2.78 |
| 20K | 4 | 1133.80 | 2.85 |
| 200K | 1 | 32.10 | 26.62 |
| 200K | 2 | 59.67 | 27.43 |
| 200K | 4 | 113.58 | 28.22 |
| 2MB | 1 | 3.17 | 270.39 |
| 2MB | 2 | 5.91 | 278.07 |
| 2MB | 4 | 11.33 | 286.60 |
| Message Size | Concurrency | Throughput (req/s) | CPU Cost/Msg (ms) |
|---|---|---|---|
| 2K | 1 | 454.71 | 1.61 |
| 2K | 2 | 857.88 | 1.60 |
| 2K | 4 | 1382.45 | 1.83 |
| 20K | 1 | 328.76 | 2.22 |
| 20K | 2 | 642.48 | 2.22 |
| 20K | 4 | 1216.21 | 2.23 |
| 200K | 1 | 108.97 | 7.48 |
| 200K | 2 | 195.60 | 7.55 |
| 200K | 4 | 332.01 | 8.68 |
| 2MB | 1 | 14.40 | 57.78 |
| 2MB | 2 | 22.43 | 70.46 |
| 2MB | 4 | 37.57 | 82.55 |
| Message Size | Concurrency | Throughput (req/s) | CPU Cost/Msg (ms) |
|---|---|---|---|
| 2K | 1 | 344.83 | 2.36 |
| 2K | 2 | 731.02 | 2.15 |
| 2K | 4 | 1414.76 | 2.14 |
| 20K | 1 | 60.39 | 14.07 |
| 20K | 2 | 132.39 | 12.09 |
| 20K | 4 | 262.10 | 12.41 |
| 200K | 1 | 7.11 | 127.01 |
| 200K | 2 | 15.11 | 112.41 |
| 200K | 4 | 28.05 | 116.99 |
| 2MB | 1 | 0.70 | 1313.74 |
| 2MB | 2 | 1.46 | 1182.75 |
| 2MB | 4 | 2.66 | 1247.52 |
| Message Size | Concurrency | Throughput (req/s) | CPU Cost/Msg (ms) |
|---|---|---|---|
| 2K | 1 | 1244.00 | 0.42 |
| 2K | 2 | 2398.66 | 0.45 |
| 2K | 4 | 4626.97 | 0.53 |
| 20K | 1 | 170.63 | 3.81 |
| 20K | 2 | 340.26 | 3.76 |
| 20K | 4 | 680.64 | 3.72 |
| 200K | 1 | 18.05 | 37.31 |
| 200K | 2 | 36.20 | 35.78 |
| 200K | 4 | 71.51 | 35.67 |
| 2MB | 1 | 1.81 | 377.54 |
| 2MB | 2 | 3.51 | 366.46 |
| 2MB | 4 | 7.04 | 363.62 |
| Message Size | Concurrency | Throughput (req/s) | CPU Cost/Msg (ms) |
|---|---|---|---|
| 2K | 1 | 2299.85 | 0.31 |
| 2K | 2 | 4273.41 | 0.30 |
| 2K | 4 | 8180.36 | 0.31 |
| 20K | 1 | 534.45 | 1.55 |
| 20K | 2 | 1058.09 | 1.43 |
| 20K | 4 | 2145.18 | 1.39 |
| 200K | 1 | 55.57 | 15.24 |
| 200K | 2 | 123.30 | 13.27 |
| 200K | 4 | 253.54 | 12.58 |
| 2MB | 1 | 5.62 | 153.38 |
| 2MB | 2 | 11.69 | 140.36 |
| 2MB | 4 | 23.08 | 135.47 |
| Message Size | Concurrency | Throughput (req/s) | CPU Cost/Msg (ms) |
|---|---|---|---|
| 2K | 1 | 200.59 | 4.36 |
| 2K | 2 | 413.59 | 4.04 |
| 2K | 4 | 796.53 | 4.03 |
| Concurrency | Throughput (req/s) | CPU Cost/Msg (ms) |
|---|---|---|
| 1 | 5.71 | 119.73 |
| 2 | 4.96 | 141.85 |
| 4 | 0.92 | 713.16 |
| Concurrency | Throughput (req/s) | CPU Cost/Msg (ms) |
|---|---|---|
| 1 | 1.68 | 360.31 |
| 2 | 1.58 | 421.40 |
| 4 | 0.15 | 4324.26 |
| Message Size | Concurrency | Throughput (req/s) | CPU Cost/Msg (ms) |
|---|---|---|---|
| 2K | 1 | 1395.53 | 0.71 |
| 2K | 2 | 2693.01 | 0.74 |
| 2K | 4 | 5386.88 | 0.74 |
| 20K | 1 | 282.13 | 3.54 |
| 20K | 2 | 553.32 | 3.61 |
| 20K | 4 | 1049.78 | 3.81 |
| 200K | 1 | 30.67 | 32.60 |
| 200K | 2 | 59.25 | 33.76 |
| 200K | 4 | 111.11 | 36.00 |
| 2MB | 1 | 2.96 | 339.70 |
| 2MB | 2 | 5.75 | 348.91 |
| 2MB | 4 | 11.03 | 364.14 |
| Message Size | Concurrency | Throughput (req/s) | CPU Cost/Msg (ms) |
|---|---|---|---|
| 2K | 1 | 1369.93 | 0.73 |
| 2K | 2 | 2709.26 | 0.74 |
| 2K | 4 | 5302.20 | 0.75 |
| 20K | 1 | 257.86 | 3.87 |
| 20K | 2 | 504.12 | 3.96 |
| 20K | 4 | 968.96 | 4.13 |
| 200K | 1 | 27.63 | 36.19 |
| 200K | 2 | 53.36 | 37.48 |
| 200K | 4 | 100.80 | 39.69 |
| 2MB | 1 | 2.68 | 374.78 |
| 2MB | 2 | 5.26 | 381.55 |
| 2MB | 4 | 10.08 | 398.44 |
| Message Size | Concurrency | Throughput (req/s) | CPU Cost/Msg (ms) |
|---|---|---|---|
| 2K | 1 | 209.57 | 2.88 |
| 2K | 2 | 349.10 | 0.93 |
| 2K | 4 | 694.95 | 1.64 |
| 20K | 1 | 153.99 | 3.73 |
| 20K | 2 | 271.26 | 2.23 |
| 20K | 4 | 468.08 | 1.26 |
| 200K | 1 | 49.16 | 20.97 |
| 200K | 2 | 70.36 | 14.67 |
| 200K | 4 | 156.44 | 15.80 |
| 2MB | 1 | 6.33 | 166.70 |
| 2MB | 2 | 3.49 | 595.22 |
| 2MB | 4 | 12.63 | 321.95 |
| Message Size | Concurrency | Throughput (req/s) | CPU Cost/Msg (ms) |
|---|---|---|---|
| 2K | 1 | 236.87 | 4.31 |
| 2K | 2 | 485.37 | 4.13 |
| 2K | 4 | 927.36 | 4.34 |
| 20K | 1 | 55.88 | 18.23 |
| 20K | 2 | 111.05 | 18.13 |
| 20K | 4 | 217.36 | 18.59 |
| 200K | 1 | 6.32 | 161.81 |
| 200K | 2 | 12.87 | 157.32 |
| 200K | 4 | 25.13 | 163.01 |
| 2MB | 1 | 0.60 | 1716.96 |
| 2MB | 2 | 1.22 | 1669.38 |
| 2MB | 4 | 2.39 | 1710.73 |
| Message Size | Concurrency | Throughput (req/s) | CPU Cost/Msg (ms) |
|---|---|---|---|
| 2K | 1 | 733.21 | 1.35 |
| 2K | 2 | 1414.25 | 1.40 |
| 2K | 4 | 2703.46 | 1.46 |
| 20K | 1 | 123.70 | 8.04 |
| 20K | 2 | 233.07 | 8.52 |
| 20K | 4 | 454.69 | 8.73 |
| 200K | 1 | 13.23 | 75.34 |
| 200K | 2 | 25.02 | 79.44 |
| 200K | 4 | 48.79 | 81.42 |
| 2MB | 1 | 1.31 | 770.70 |
| 2MB | 2 | 2.46 | 811.06 |
| 2MB | 4 | 4.82 | 827.93 |
| Message Size | Concurrency | Throughput (req/s) | CPU Cost/Msg (ms) |
|---|---|---|---|
| 2K | 1 | 1552.27 | 0.64 |
| 2K | 2 | 3375.68 | 0.59 |
| 2K | 4 | 6541.38 | 0.61 |
| 20K | 1 | 837.51 | 1.19 |
| 20K | 2 | 1728.90 | 1.16 |
| 20K | 4 | 3365.10 | 1.19 |
| 200K | 1 | 139.73 | 7.10 |
| 200K | 2 | 228.26 | 7.19 |
| 200K | 4 | 463.77 | 7.80 |
| 2MB | 1 | 12.88 | 70.50 |
| 2MB | 2 | 22.88 | 73.22 |
| 2MB | 4 | 49.40 | 76.24 |
| Message Size | Concurrency | Throughput (req/s) | CPU Cost/Msg (ms) |
|---|---|---|---|
| 2K | 1 | 167.90 | 5.95 |
| 2K | 2 | 336.45 | 5.97 |
| 2K | 4 | 658.89 | 6.07 |
| Concurrency | Throughput (req/s) | CPU Cost/Msg (ms) |
|---|---|---|
| 1 | 4.72 | 202.34 |
| 2 | 5.71 | 198.71 |
| 4 | 5.73 | 202.01 |
| Concurrency | Throughput (req/s) | CPU Cost/Msg (ms) |
|---|---|---|
| 1 | 1.14 | 795.15 |
| 2 | 1.38 | 776.26 |
| 4 | 1.43 | 793.37 |


[{"Type":"MASTER","Line of Business":{"code":"LOB77","label":"Automation Platform"},"Business Unit":{"code":"BU048","label":"IBM Software"},"Product":{"code":"SSDR5J","label":"IBM App Connect Enterprise"},"ARM Category":[{"code":"a8m0z000000brDHAAY","label":"ACE"}],"ARM Case Number":"","Platform":[{"code":"PF002","label":"AIX"},{"code":"PF016","label":"Linux"},{"code":"PF033","label":"Windows"}],"Version":"13.0.0"}]
Was this topic helpful?
Document Information
Modified date:
08 August 2025
UID
ibm17235050