News
Abstract
The following updates are available in release 2.0.87 SC of Planning Analytics Workspace.
Content
The following new and changed features in books and reporting are available in Planning Analytics Workspace 2.0.87.
Search and filter capability available for current set in the set editor
The Current set pane in the new experience set editor now has search and filter capabilities. Previously, these features applied only to the Available members pane in the set editor.

For example, when you enable synchronization for the same hierarchy that is in two different databases, changes you make to the data in one widget are reflected in the synchronized widget.
To filter the Current set, click Filter and add your parameters. You can filter a set by up to three parameters at a time.
Use Search to look for members in the current MDX state for the Current set.
To filter the Current set, click Filter and add your parameters. You can filter a set by up to three parameters at a time.

After you apply a filter, the filter parameter clears from the Filter menu, allowing you to add more filters to further narrow your member selections. In an already filtered set, any new filter that you add, applies to the MDX state around the first filter.

At any time, you can click Undo to clear your search or applied filters and return to the original set.
Target selection design and usability improvements
The target selection option is now available on the toolbar. Previously, the Target selecting toggle was available on the view grid. You can now also enable target selection mode with the keyboard shortcut F7.

There is no change to how target selection feature, but the availability of Target selection on the toolbar and the new keyboard shortcut makes it easier to use the feature. Click the Target selection icon in the toolbar (or press F7) to quickly go into target selection mode and make asymmetric selections or calculations.
Expand and collapse rows and columns asymmetrically or symmetrically
You can now expand and collapse rows and columns in a view either asymmetrically or symmetrically. Click the new Expand/Collapse icon in the toolbar and select how you want to expand and collapse rows and columns.

By default, expansion and collapse of rows and columns in views is asymmetrical. This means you can expand or collapse nested members individually.

In symmetrical expansion, expanding a nested member automatically expands that member across all hierarchies. In the following example, notice how expanding S Series 2WD for Denmark expands S Series 2WD for all countries.

Tip: If you set Expand/Collapse to be symmetrical but need to make an asymmetric gesture, you can do so with Target selection. Click Target selection or press F7, and expand or collapse an individual nested member.
Zoom bar available in additional visualizations
The zoom bar is now available in the following visualizations. The zoom bar allows you to scroll and focus on a smaller area of a visualization.
- Box plot
- Marimekko
- Heat map
- Waterfall
- Bullet
The zoom bar property was previously available only in the Area, Line, Line and column, Bar, Bubble, Point, Scatter, Stacked bar, Stacked column, and Tree map visualizations.
Use the Enable zoom bar property to add the zoom bar to your visualization. Drag a handle on the bar to zoom and focus on an area in the visualization. The area of focus changes as you drag the handle.

Note: When you enable the zoom bar, mouse scrolling is disabled in the visualization.
New properties in the Map visualization
The Map visualization was updated in this release to include the following new properties:
World View
The World View property displays disputed country borders from the perspective of different countries.
In the World View property under Chart, select a country and notice how the visualization changes the way disputed country borders display based on the selected country's perspective.
- IN - India
- CN - China
- JP - Japan
- AR - Argentina
- MA - Morocco
- RU - Russia
- TR - Turkey
Icons
You can now select a pre-defined icon for points on a Map. Under Points layer in visualization properties, select an icon from the Icon property dropdown. You can also select a custom icon.
Note: To use a custom icon, you need to create a custom style and add an icon in Mapbox. You can then import the custom style in Planning Analytics Workspace.
Use the Allow overlap if you want the icons to display on each point even if another element (such as point labels) is conflicting with the icons.
You can hide the default circle icon for points in the Map by setting the Transparency property to 100%.
Show map labels
Turn on the Show map labels under Chart to see background map labels.
New properties and other changes for the Bullet visualization
The Bullet visualization was updated in this release to include the following new properties and changes:
New categories slot
A new Categories slot under Fields lets you draw multiple bullets without the use of Repeat slots. The Categories slot allows more sorting capabilities such as sorting by Target and Bar values.
Style gridlines, axes lines, and axes labels
Item axis properties and additional value axis properties are now available under Axis in Properties. You can style gridlines, axes lines, and axes titles and labels. You can also set value axis minimum and maximum values.
Padding properties
You can now set bullet and target marker padding under Chart in Properties.
You can also specify the thickness of the target marker. Target marker thickness is set to 4 px by default.

Zoom bar
Click Enable zoom bar under Chart to display a zoom bar in the visualization, which allows you to scroll and focus on a smaller area of the visualization.
Manual range values
You can now specify minimum, mid, and maximum range values manually under the new Ranges section in Properties.

Legend alignment in visualizations
A new Legend alignment property in visualizations allows you to position a legend in the desired area of your visualization.
You can now align a legend vertically to display at the start, center, or end of the plot area in visualizations. In combination with the Legend position, this new property allows you to position the legend in twelve different areas in the visualization.
- In Edit mode, click the visualization.
- Go to Properties > Visualization properties > Legend.
- Select the desired Legend alignment.
Configuration modification for Learn Pane in Planning Analytics Workspace Local and Cloud Pak for Data
The cognitive Learn Pane in Planning Analytics Workspace Local is now hosted on a new domain. This change requires the following configuration modifications to Planning Analytics Workspace Local and Planning Analytics on Cloud Pak for Data to ensure continued access to documentation and other information through the Learn Pane.
Important: The change in hosting domain does not interrupt access to content through the Learn Pane for Planning Analytics Workspace on Cloud or Planning Analytics as a Service.
Planning Analytics Workspace Local Linux and Windows
- Edit <paw_install>/services/glass/docker-compose.yml to include the environment variable CCH_URL=https://cchhelp.pac.cloud.ibm.com/docs/cch.

Important: The indentation of these new lines must match the indentation of the existing container properties.
- To apply the change, run scripts/paw.sh if you are on Linux or scripts\paw.ps1 on Windows.
Planning Analytics Workspace Local Distributed Swarm
- Edit <paw_install>/paw_2.0.XX/swarm/deployments/paw.yml to find the glass: service definition.
- Under the glass service properties, add the environment variable CCH_URL=https://cchhelp.pac.cloud.ibm.com/docs/cch.

Important: The indentation of these new lines must match the indentation of the existing service properties.
-
Run <paw_install>/start.sh to apply the change.
Planning Analytics Workspace Local Distributed Kubernetes
- Edit <paw_install>/paw_2.0.XX/kubernetes/templates/any-node/pa-glass-deployment.yaml to find the glass container definition under containers:.
- Add an environment variable under the env: section and set the variable CCH_URL=https://cchhelp.pac.cloud.ibm.com/docs/cch as follows:

Important: The indentation of these new lines must match the indentation of the existing container environment properties.
-
Run <paw_install>/start.sh to apply the change.
Planning Analytics on Cloud Pak for Data
Run the following command:
oc set env deployment glass CCH_URL=https://cchhelp.pac.cloud.ibm.com/docs/cch -n <cpd-instance-ns>
The following new and changed features in plans and applications are available in Planning Analytics Workspace 2.0.87.
New tabs on the contribution panel show submission and approval tasks
New tabs on the Plans contribution panel now display open tasks that are assigned to you for contribution and approval. These new tabs let you quickly submit tasks and approve or reject submissions from one place in the Plan.

You see these tabs only if you have open tasks that need contribution and approval.
Note: After you submit a task or approve or reject a task, the task no longer displays on its respective tab in the contribution panel.
The following new and changed modeling features are available in Planning Analytics Workspace 2.0.87.
Use the new 'View related cubes' option to identify which cubes include a specific dimension
You can now quickly identify which cubes on a Planning Analytics database include a specific dimension. This is helpful when you are thinking about deleting a dimension, but want to see the impact of the deletion on the cubes on your database.
The new View related cubes option is available only on a modeling workbench. The option is available on the right-click menu anywhere you can see an individual dimension name on the Databases tree:
- DatabaseName > Dimensions > DimensionName
- DatabaseName > Cubes > CubeName > Dimensions > DimensionName
- DatabaseName > Control Objects > Control Dimensions > DimensionName
- DatabaseName > Control Objects > Control Cubes> CubeName > Dimensions > DimensionName
- Right-click a dimension on the Databases tree on a modeling workbench.
- Click View related cubes.
If the dimension is not included in any cubes, you receive notification and can cancel the procedure.
- On the Related cubes window, toggle the Include control cubes option to show or hide control cubes in the list of cubes.
- In the Cubes list, select the cubes you want to open for review.
If the dimension is included in five or fewer cubes, the cubes are shown in a simple list.
If the dimension is included in more than five cubes, the cubes are shown in a searchable menu list.

- Click Open.
Each of the cubes you selected opens for review on a separate tab on the modeling workbench.
Use the new editors to manage attributes and security for database objects
New settings editors are available from the Databases tree on a modeling workbench. These editors simplify the task of managing attributes or security for your database objects.
Previously, a single settings editor contained multiple interfaces to manage attributes and security for database objects. In Planning Analytics Workspace 2.0.87, a dedicated attributes editor and a dedicated security editor is available for each of these object groups:
- Cubes
- Dimensions
- Processes
- Chores
Manage attributes for a database object group
- On the Database tree on a modeling workbench, right-click the object group for which you want to manage attributes: Cubes, Dimensions, Processes, or Chores.
- Click ObjectName Attributes. For example, Cube Attributes or Chore Attributes.
A modified view of the applicable control cube opens, with individual database objects on the row axis and attributes on the column axis.
For example, here's the view of the }DimensionAttributes cube you see when you click Dimensions > Dimension Attributes.
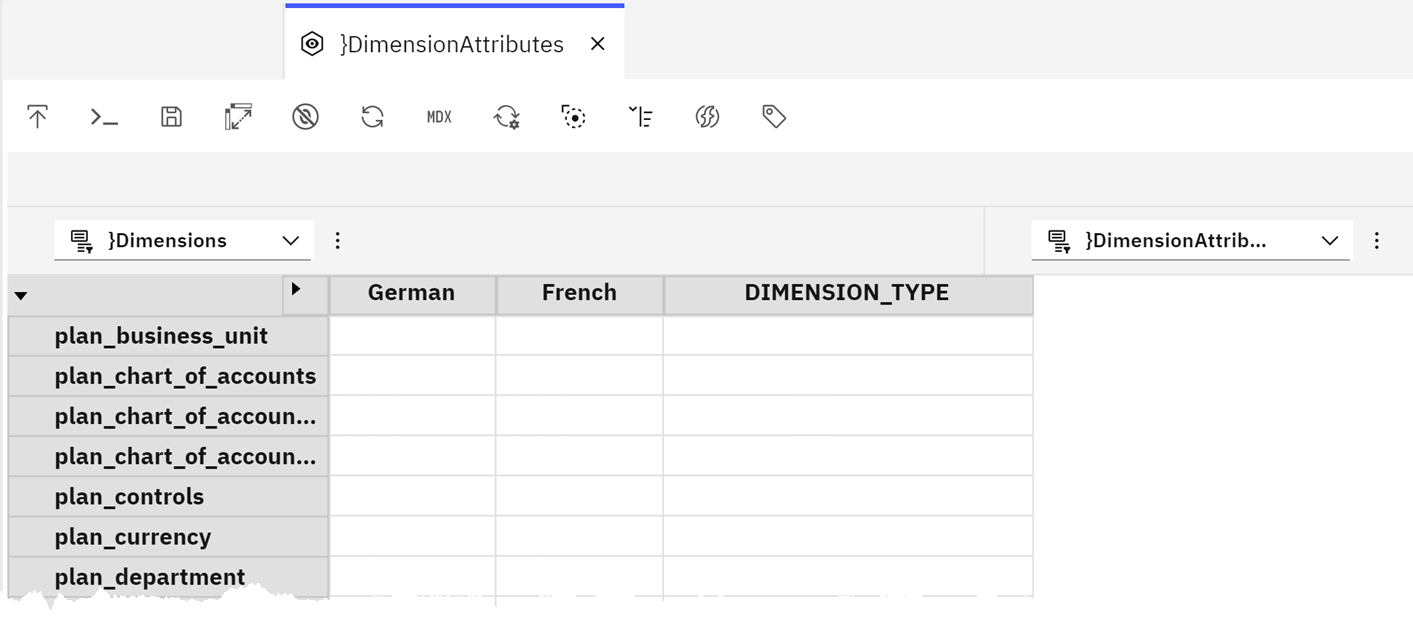
- Click a cell at the intersection of an object and an attribute and enter or modify the attribute value.
You can use Cut, Copy, and Paste to manage attribute values. You can also use the standard view options to manage sets and to select multiple cells, rows, or columns in the editor.
Manage security for a database object group
- On the Database tree on a modeling workbench, right-click the object group for which you want to manage security: Cubes, Dimensions, Processes, or Chores.
- Click ObjectName Security. For example, Cube Security or Chore Security.
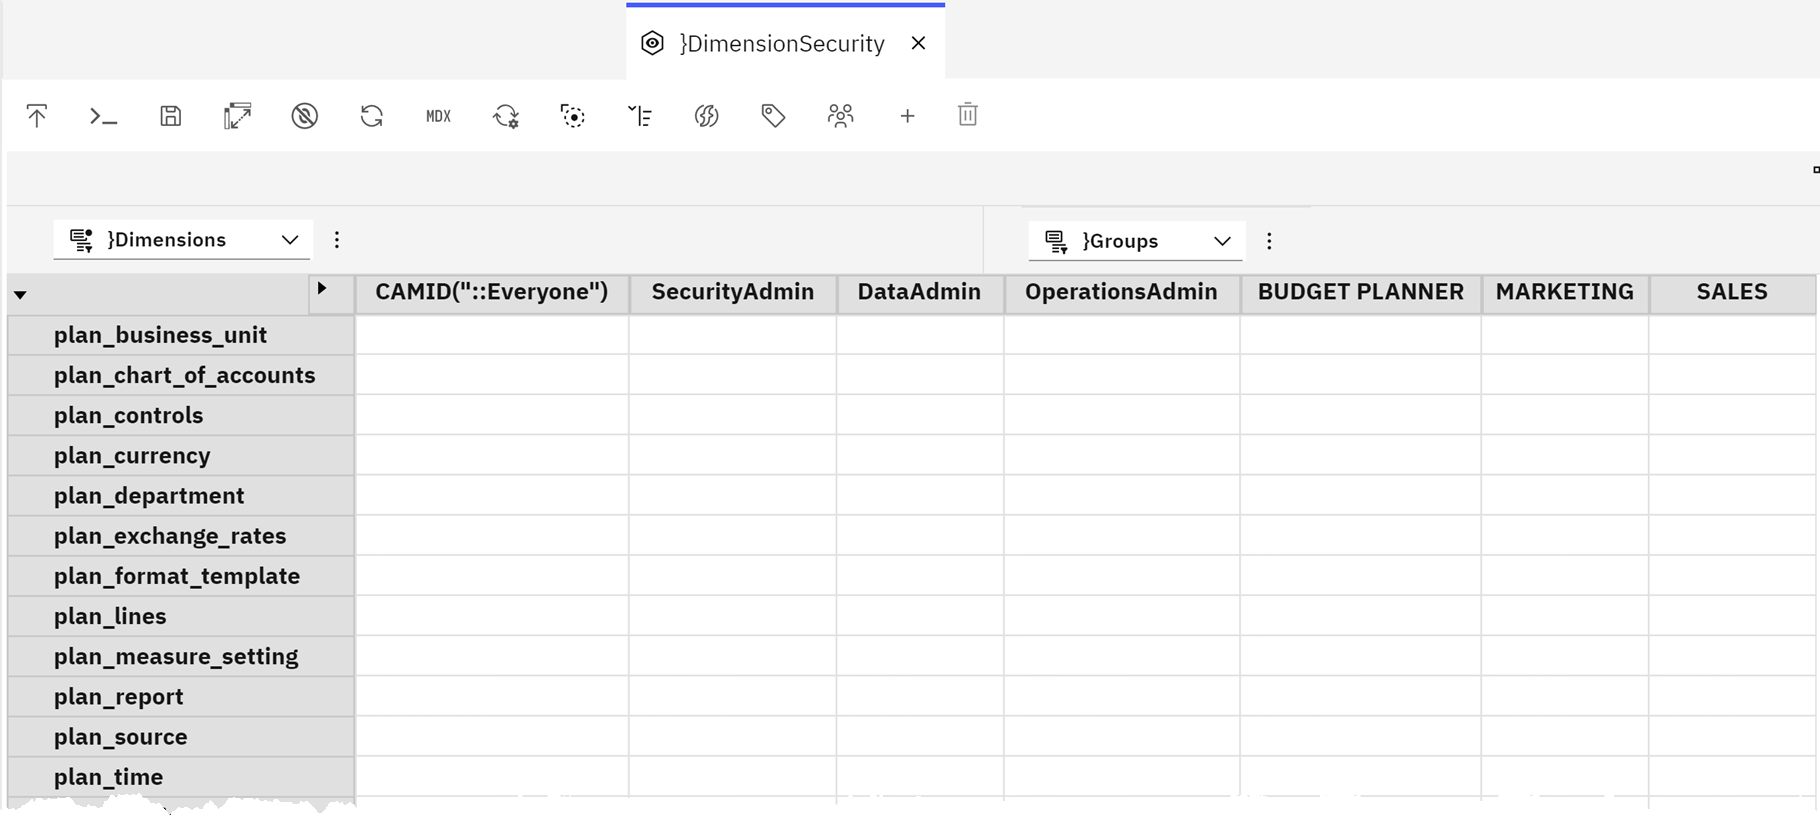
A modified view of the applicable control cube opens, with individual database objects on the row axis and user groups on the column axis.
For example, here's the view of the }DimensionSecurity control cube you see when you click Dimensions > Dimension Security.
You can use these options to manage security for objects on the Planning Analytics database:
- To assign security for a single user group to a single object, double-click the cell at the intersection of the user group and object, then click the desired security level.
- To assign security to multiple adjacent cells, click the first cell and Shift+click the last cell, then right-click the last cell and click Cell security.
- To assign security to multiple nonadjacent cells, Shift+click each cell, then right-click the last cell and click Cell security.
- To assign security for an entire row, right-click the element name on the row header, then click Cell security. You can also use Ctrl+click or Shift+click to select multiple rows.
- To assign security for an entire column, right-click the element name on the column header, then click Cell security. You can also use Ctrl+click or Shift+click to select multiple columns.
- You can also use the security editor to import groups and users from Planning Analytics Workspace into the Planning Analytics database or to create a new group on the Planning Analytics database. You can then immediately apply security to the new groups.
- To create a new user group on the database, click
 .
. - To add groups that exist in Planning Analytics Workspace to the Planning Analytics database, click
 . Select the groups, then click Add.
The groups are added to the database. In addition, any users within the groups are also added to the database and assigned to the appropriate groups.
- To create a new user group on the database, click
Manage cell security with a more flexible control cube structure
Previously, a cell security control cube contained all dimension from the data cube, plus the }Groups dimension. In Planning Analytics Workspace 2.0.87, you can select which dimensions to include in a cell security control cube, which can make it easier to manage security.
- To create cell security, right-click a cube on the Databases tree on a modeling workbench, then click Create cell security.
- Select the dimensions that you want to include in the cell security cube.
- Click Create.

In addition to the more flexible cell security cube structure, Planning Analytics Workspace 2.0.87 also introduces the ability to delete cell security for a cube.

Import a data source with multiple data value columns to an existing cube
If a data source includes multiple data value columns, you can now create mappings to import all data columns simultaneously into an existing cube.
You cannot import multiple data columns when creating a new cube.
For example, this data source includes value columns for both Quantity and Sales dollars.
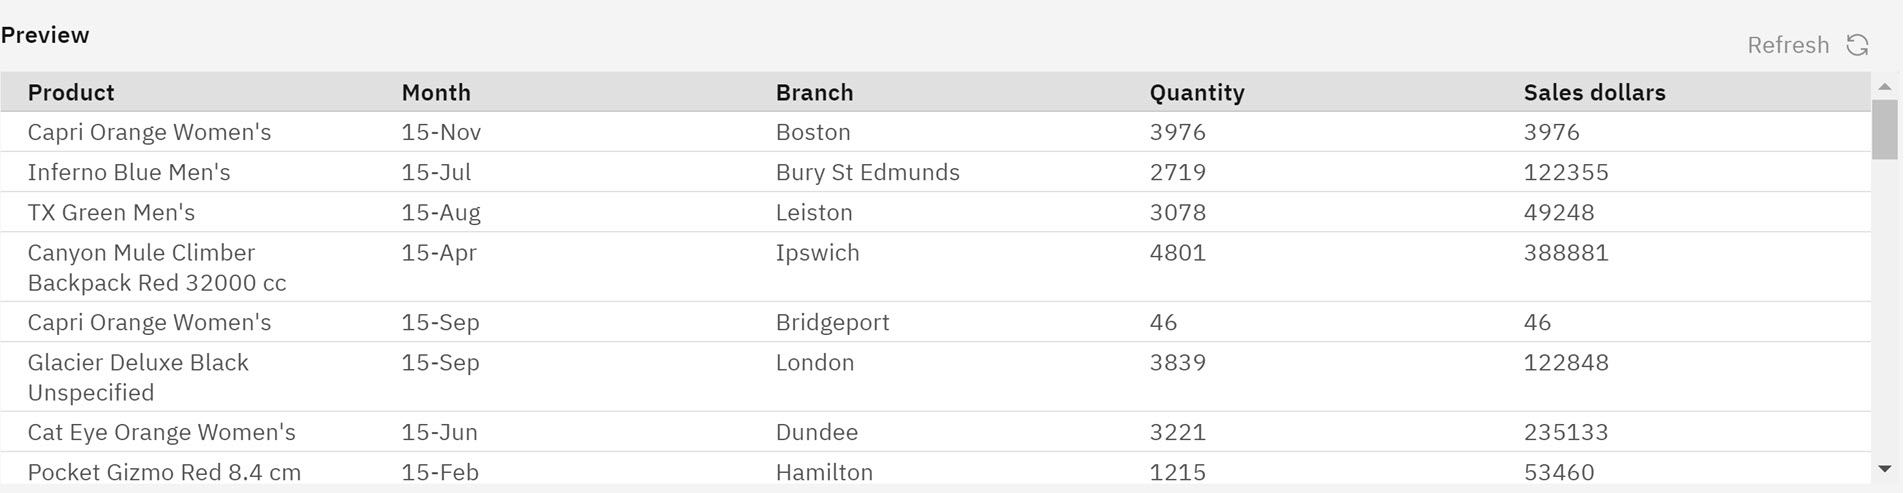
In this case, Quantity and Sales dollars correspond to elements of the Measures dimension in an existing cube. When you map an existing cube dimension to Data values in the data source mapping, a new Select element mapping option becomes available, which you can use to map individual elements to value columns in the source.

You can click Select element to pick a Measures dimension element in the existing cube, and then click Select mapping to map the Measures element to a value column in the data source. In this example, the Qty member in the Measures dimension maps to the Quantity value column in the data source.

Because the data source has multiple data value columns, you can click Add data + to create additional data mappings. Again, using our example, we know there is a Sales member in the Measures dimension, you we can map it to the appropriate value column in the data source.

When all the data value columns in the data source are mapped, the Add data + option is disabled.
The following new and changed administration features are available in Planning Analytics Workspace 2.0.87.
View the last login date for Planning Analytics Workspace users
Administrators can now view the last login date for users on their Planning Analytics Workspace environment.
The last login date is not exposed in the Planning Analytics Administration interface, but is included when you download a user report to a .csv file.
- Open Planning Analytics Administration.
- Click the Users and groups tile.
- Click Download users.

- Open the downloaded all-users.csv file.
The Last Login column shows the date and time of the most recent login for the users on your database.

The Last Login column is ignored if you use the all-users.csv file to upload users to a database.
Include modeling workbenches in Lifecycle Management snapshots
You can now include modeling workbenches when you use Lifecycle Management to copy and deploy Planning Analytics assets.
When you create a snapshot, the Workbench asset type is available when you filter or choose assets for inclusion in the snapshot.

For more information, see Copy and deploy assets with Lifecycle Management in Planning Analytics Workspace.
Was this topic helpful?
Document Information
Modified date:
12 May 2023
UID
ibm16988343