White Papers
Abstract
Kushagra Goyal,
Senior Technical Specialist
This Whitepaper is intended to provide assistance to install “IBM Debug for z/OS”, configure environment and collaborate it with “Business Developer (RBD)” to debug EGL/COBOL on zOSBatch and CICS.
Content
Introduction
Business Developer (RBD) provides business developers with an integrated environment to develop Enterprise Generation Language (EGL) applications, which are generated into COBOL, Java, and JavaScript applications. The developers work with EGL to develop their applications. Currently, Business Developer (RBD) has the capability of debugging EGL code.
Through this whitepaper, we detail out the steps that are to be taken to collaborate IBM Debug for z/OS with Business Developer (RBD) for debugging EGL/COBOL code in zOSBatch and CICS environment. When all the steps are followed then its user will have a seamless debugging experience between EBL and COBOL programs.
This whitepaper has been divided into two parts which are:
· Part 1 – Provide details about installation, configuration, and usage of IBM Debug for z/OS on user machines.
· Part 2 – Provide details about how a user can seamlessly debug using EGL debugger and IBM debugger (aka IBM Debug for z/OS).
In this document, we may call IBM Debug for z/OS as IBM debugger for the ease of reading.
Pre-requisite
· IBM z/OS Debugger V14 should be installed on the mainframe system.
· Business Developer (RBD) should be available on the user machine.
· CICS Transaction Gateway should be available on the user machine.
· IBM Debug for z/OS [Aqua 3.1 (Eclipse Neon v4.6)] – installation details are available in the next section.
Part - 1
1. Purpose
The purpose of this document is to share information about installation, configuration, and usage of IBM Debug for z/OS tool to work in collaboration with Business Developer. The details in scope of this document are related to IBM Debug for z/OS [Aqua 3.1 (Eclipse Neon v4.6)]
2. Installation details and setup at the host side
The client version of IBM Debug for z/OS (Aqua 3.1) tool can be downloaded from the below link:
https://developer.ibm.com/mainframe/products/downloads/eclipse-tools/
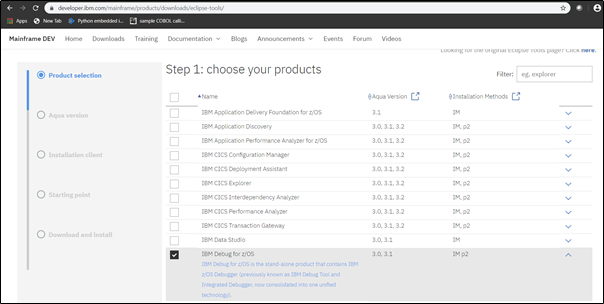
To begin with the installation of the above tool, the user may require the installation of the latest version of IBM IM (Installation Manager) to support IBM Debug for z/OS installation.
Please note that on the host, a remote debugger was installed (V14) to support the client debug tool. To make Debugger usable at a client workstation, setup is required to be done at host side which is stated as below:
2.1 CICS
a. The start-up JCL should be updated as stated:
i. Under STEPLIB and DSN of Debugger

ii. Under DFHRPL add the following DSNs

2.2 zOSBatch
a. In the run JCL, instead of calling PROGRAM NAME directly make changes as explained:
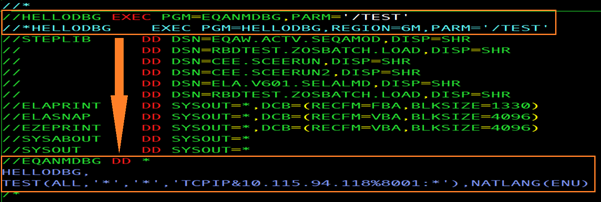
b. Last line in the above snapshot has the machine IP on which the client IBM Debug for z/OS is running.
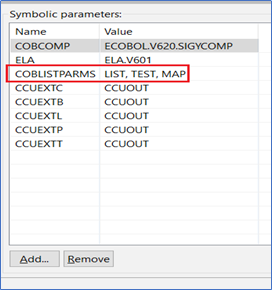
Please note that in RBD programs should be compiled with option TEST as stated below in the build descriptor for both CICS and zOSBatch:
3. Configuring DTCN Transaction for CICS and zOSBatch
3.1 CICS
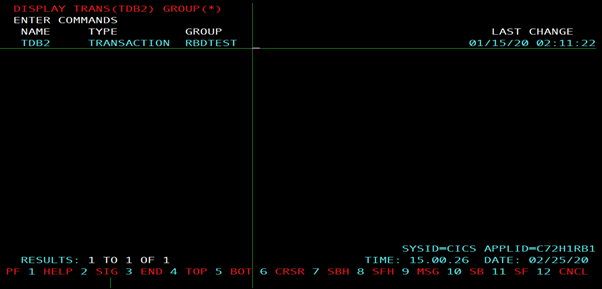
· After login on CICS terminal, display program details that will be debugged
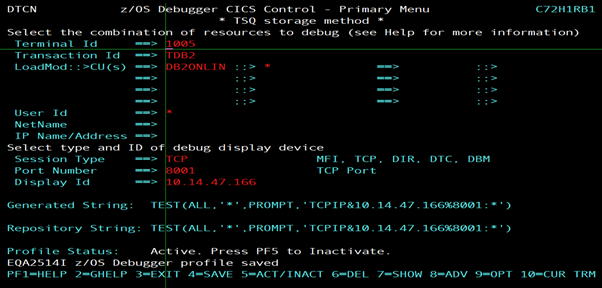
· Please issue command DTCN. Fill in the parameters as mentioned below:
· Press F9 and change TEST LEVEL from ERROR to ALL (refer to below screen) and press F3.
· After coming back to the initial DTCN screen press F4 for saving and activating the changes to DTCN.
· Press F5 to activate/deactivate the debug setup for debugging.
· Use F3 to exit from DTCN entry.
· Now, give transaction TDB2 on CICS screen to start debugging the associated program to this transaction.
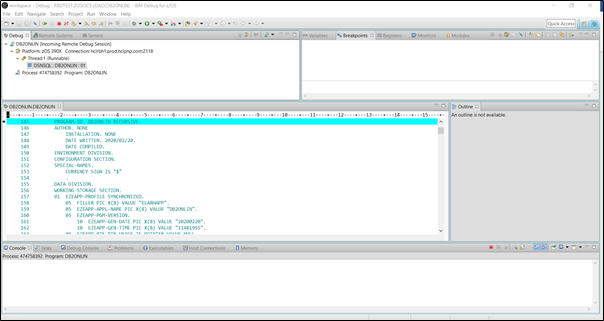
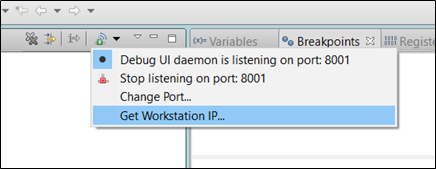
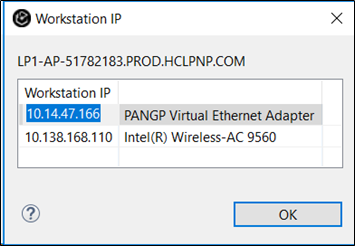
· To get the IP, we can go to the debugger screen and click on the black drop-down icon. Then click on ‘Get Workstation IP…’
3.2 zOSBatch
Please refer to point 2.2 in this document to setup the DTCN for zOSBatch.
4. References
· IBM z/OS Debugger User’s Guide https://www.ibm.com/support/knowledgecenter/SSUFAU_2.0.0/com.ibm.debugtool.doc/eqacus00.pdf
· IBM z/OS Debugger Customization Guide https://www.ibm.com/support/knowledgecenter/SSUFAU_2.0.0/com.ibm.debugtool.doc/eqaccg00.pdf
Part - 2
1. Purpose
In continuation to part 1, this section is about sharing information on how to debug seamless from EGL debugger (provide as part of RBD) to IBM debugger (i.e. IBM Debug for z/OS [Aqua 3.1 (Eclipse Neon v4.6)]) and back to EGL debugger.
2. Steps to configure debug session
Kindly follow the below steps for debugging an EGL program and call(s) from EGL to other programs (COBOL etc).
i. Configuring CICS Transaction Gateway
ii. CPMI Details
iii. Linkage Details
iv. DTCN setup
v. Program details
vi. Demonstration
I. Configuring CICS Transaction Gateway
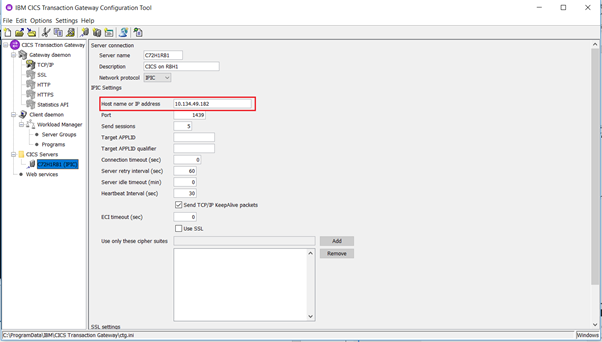
· Under CICS Transaction Gateway, please setup the new server for CICS and provide necessary details as stated in the below image. Please note server details will vary for each customer.
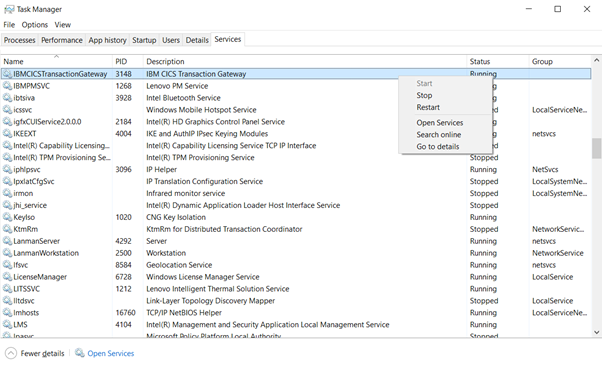
· Using Windows Task Manager, please ensure that the corresponding service is up and running. If not, please start the service.
II. CPMI Details
CPMI supports mirror transactions that run the request from initiated transactions. It returns the response code, control fields, and data that are associated with the request to the local system. While setting up a debug session using DTCN, the field Transaction ID is set to CPMI.
III. Linkage Details
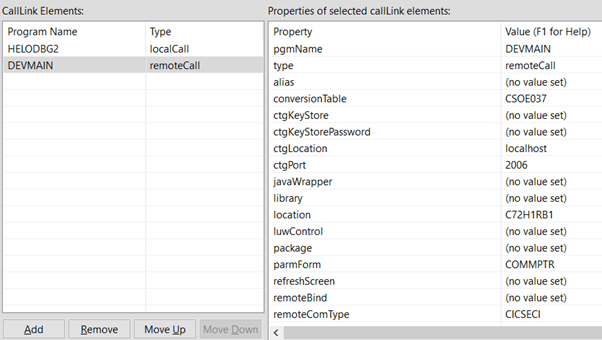
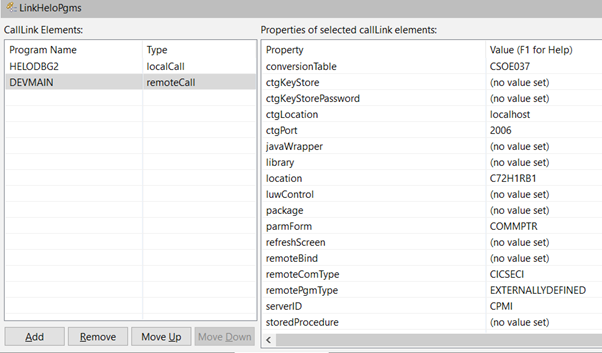
In RBD, we have to setup linkage parameters as depicted in below steps:
1. Open Build Descriptor associated with the project.
2. Right-click on <ProjectName>.eglbuild and click on ‘Add Part’ -> ‘Linkage Options’

3. Provide a suitable name and description and click on ‘Finish’.
4. In the Linkage Option sub-window, click on ‘Add’.
5. Change the name of the program to which you want to call from the EGL program. In our case, it is ‘DEVMAIN’ and select the type as ‘Remote Call’.
IV. DTCN Setup
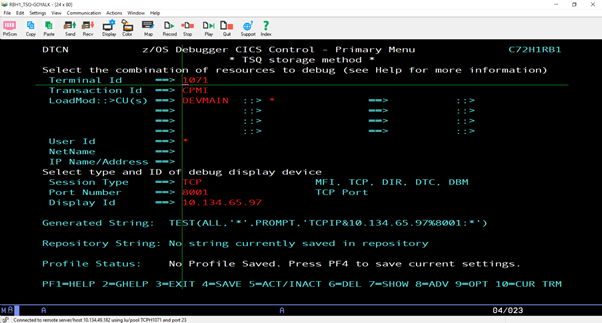
Please setup the DTCN as stated below:
1. Transaction ID should be set as – CPMI
2. LoadMod – Should have the list of programs that are to be debugged. Please remember that the Linkage Section should be setup to trace those programs.
V. Program Details
In EGL, we created a program called HELLODBG. This program calls a standalone COBOL program ‘DEVMAIN’ present in the CICS region.
The linkage has been setup for ‘DEVMAIN’ in RBD -> Build Descriptor -> Linkage Options -> LinkHeloPgms -> DEVMAIN.
VI. Demonstration
In the EGL program, one can add a breakpoint as shown below:
1. Open the EGL program that needs to be debugged.
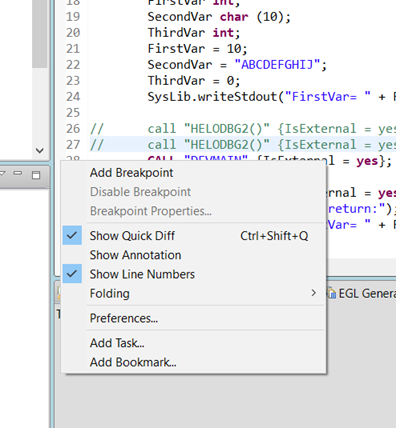
2. To add a breakpoint on a specific line, do a right-click on that line and click on Add Breakpoint.
3. After adding a breakpoint, you can see a blue dot appearing before the line number.

4. Now, right-click on the program name under Project Explorer and click on the ‘Debug As’ -> ‘EGL Program’ option as shown below:

5. Next, you will see a debugger perspective getting active in the RBD window.
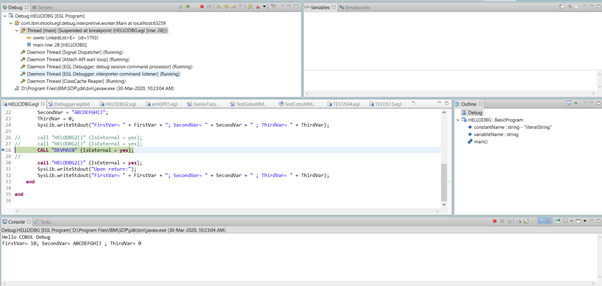
We can see the output of line 24 under the ‘Console’ section. The control currently is present at the breakpoint set in the EGL program.
6. Now pressing F5 at this point will move the control from RBD to IBM Debugger Desktop application for further debugging.
RBD Screen:
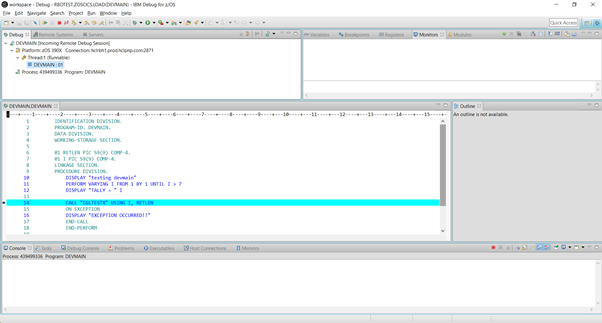
IBM Debugger Screen:

7. Pressing F5 in the IBM Debugger window would begin the debugging.
8. Upon completion from IBM debugger the debug control returns back to RBD.
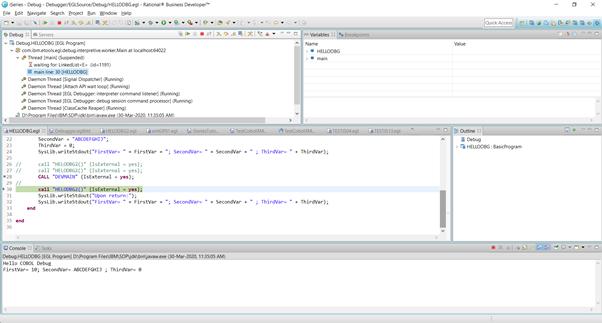
9. Once the control is back, the user can continue with the debugger in RBD for the rest of the EGL program.
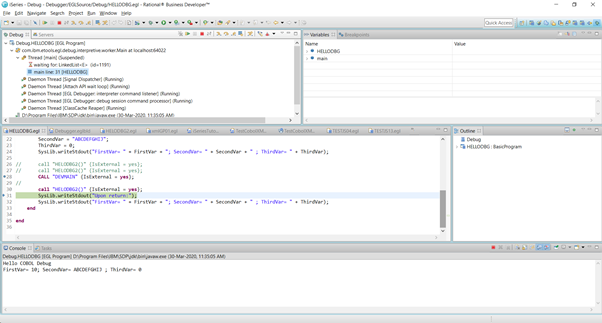
Conclusion
This whitepaper has described how a user can debug seamlessly between EGL and COBOL in both zOSBatch and CICS environment. We have also discussed how users can install IBM Debug for z/OS, configure, and use it for a better debugging experience using a well-developed GUI as provided by the tool. This will provide an enhanced environment for the EGL/RBD developers.
Was this topic helpful?
Document Information
Modified date:
16 June 2022
UID
ibm16587459
