Question & Answer
Question
Why am I not able to see events associated with an offense, especially when the number of associated events is high?
Consider an offense like the one displayed here (notice the high number of associated events):
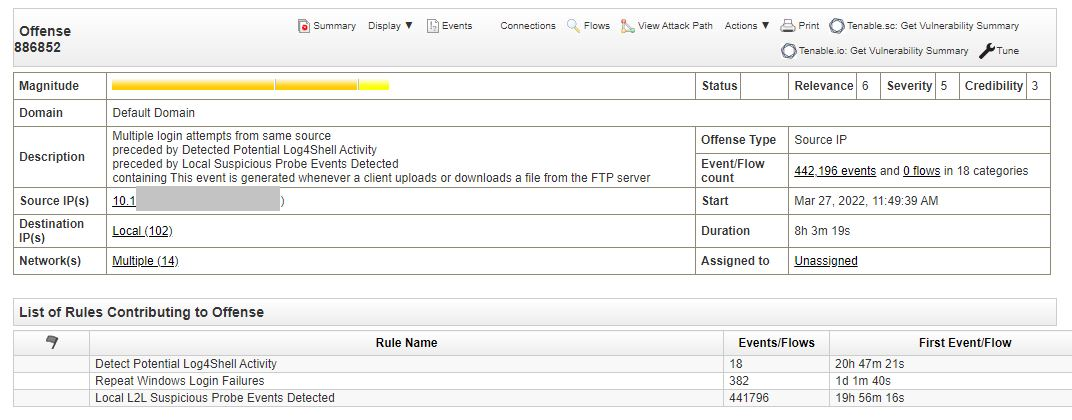
When you click on the events hyperlink under Event/Flow count, an empty list is displayed:

[{"Type":"MASTER","Line of Business":{"code":"LOB77","label":"Automation Platform"},"Business Unit":{"code":"BU048","label":"IBM Software"},"Product":{"code":"SSBQAC","label":"IBM Security QRadar SIEM"},"ARM Category":[{"code":"a8m0z000000cwthAAA","label":"Offenses"}],"ARM Case Number":"","Platform":[{"code":"PF025","label":"Platform Independent"}],"Version":"All Versions"}]
Log InLog in to view more of this document
This document has the abstract of a technical article that is available to authorized users once you have logged on. Please use Log in button above to access the full document. After log in, if you do not have the right authorization for this document, there will be instructions on what to do next.
Was this topic helpful?
Document Information
Modified date:
19 April 2022
UID
ibm16569931