Troubleshooting
Problem
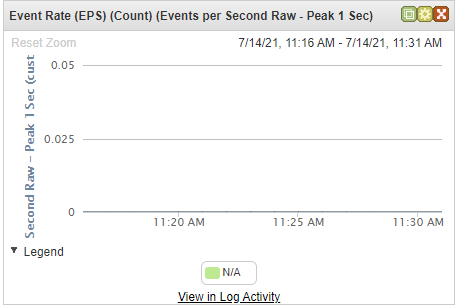
Symptom
Cause
The Event Rate (EPS) dashboard widget might be blank if the relevant data is not being extracted at the Device Parsing stage of the event pipeline. When the RegexMonitor thread detects that the regex pattern extraction for any Custom Event Property (CEP) is running for over two seconds on one event, that CEP is disabled.
Here is a log excerpt demonstrating the error that is generated when RegexMonitor disables a property that exceeded the two second threshold:
Jul 29 11:43:41 ::ffff:xxx.xxx.xxx.xxx [ecs-ec.ecs-ec] [Event Parser[5]] com.q1labs.core.shared.ariel.
ArielPropertyRegexExpressionDefinition: [WARN] [NOT:0030004100][x.xx.xxx.xxx/- -] [-/- -]Expression
"StatFilter.+1s\:\d+\,\d+\s\(peak\s\d+\,(\d+)" for custom property "Events per Second Raw - Peak
1 Sec" with ID 216f41ac-d7e8-4c74-95c8-1e59cff1c371 has taken too long.  This expression has
reached the maximum number of cancelations (1) and will be disabled.  Please check the validity of
the expression. Payload was "Jul 29 11:33:09 127.0.0.1  [[type=com.ibm.si.ec.filters.stat.StatFilter]
[parent=qradar74-ec.cslab.iss.local:ecs-ec/EC/Processor2]] com.ibm.si.ec.filters.stat.StatFilter:
[INFO] [NOT:0000006000][x.xx.xxx.xxx/- -] [-/- -]
Events per second: 1s:12,12 (peak 3442,3442) (compression: 0) 5s:59,59 (peak 738,738) (compression:
 0) 10s:62,65 (peak 535,535) (compression: 4) 30s:60,63 (peak 327,327) (compression: 4) 60s:60,63
(peak 190,191) (compression: 5)
Diagnosing The Problem
In the Event Rate (EPS) dashboard, click View in Log Activity to open a log activity search for the relevant event logs. If the search results table shows no values for the EPS/FPS fields, it is a good indication that the relevant values are not being extracted from the events correctly.
Check the Custom Event Properties configuration to confirm that the blank EPS graph is caused by disabled properties:
- In the QRadar Console GUI, navigate to the Admin -> Data Sources -> Custom Event Properties
- Filter with the string 'events' or 'flows' in the Search Properties box.
- Check to see whether any of these CEPs are disabled:
- Events per Second Coalesced - Average 1 Min
- Events per Second Coalesced - Peak 1 Second
- Events per Second Raw - Average 1 Min
- Events per Second Raw - Peak 1 Second
- Flows per Second - Average 15 Min
- Flows per Second - Peak 1 Min
- Parent
- Flow Source

The administrator confirms that any of the CEPs related to the dashboard are disabled and continues with the section "Resolving The Problem".
Resolving The Problem
- Log in to the QRadar user interface as an Administrator
- Navigate to Admin > Custom Event Properties
- Search for the disabled CEP and enable it.
- If these are enabled, make sure the StatFilter events are searchable in 'Log Activity' System Notification events.
- You can use a 'Payload contains' filter for 'StatFilter' and search for the last 5 minutes to confirm they are present.
The EPS graphs under the System Monitoring Dashboard work as expected. If the issue persists, please contact QRadar Support for assistance.
Document Location
Worldwide
Was this topic helpful?
Document Information
Modified date:
26 August 2021
UID
ibm16472023