Troubleshooting
Problem
Use this document to analyze a heap PEX trace to identify a heap leak.
Resolving The Problem
PEX heap traces are used to isolate which programs and procedures are allocating the most heap storage during an active trace. The PEX trace must be active while the heap consumption is occurring. If heap errors are already being signaled because the heap is full, then the heap must first be reset and the workload restarted before starting the trace. The scope of PEX heap trace should be limited to the specific heap type, specific jobs, and a specific heap control segment. Since heaps can have high volumes of activity and heap leaks can be very slow, scoping the trace correctly reduces the size of the trace and allows for a larger window of time to capture the issue.The approach for analyzing a PEX heap trace to identify a leak in SLIC and MI heaps used by the IBM i OS is the same, regardless of the the type of heap. The following steps are applicable to all PEX heap trace types: *ACTGRPHEAP, *RESHEAP, *SYSHEAP, *HDLHEAP, *LCLHEAP, *USRHEAP.
Step 1: Install IBM iDoctor for IBM i PEX Analyzer:
IBM iDoctor for IBM i PEX Analyzer can be downloaded and a temporary key requested here:
IBM iDoctor for IBM i
https://www.ibm.com/it-infrastructure/services/lab-services/idoctorStep 2: Launch PEX Analyzer from the IBM iDoctor for IBM i client and navigate to the library containing the PEX data
a) Verify that the start and end times of the trace are correct
b) Verify that events were captured

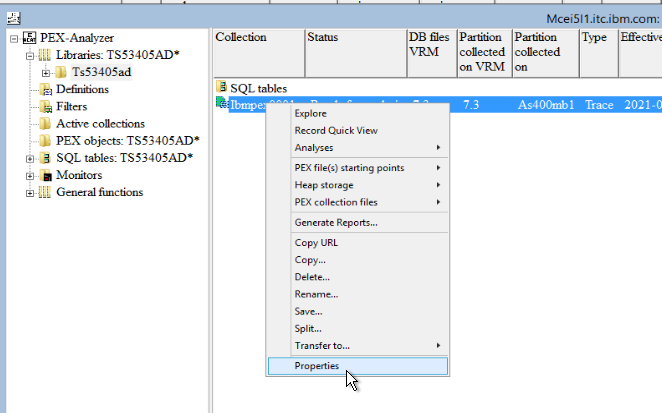
Step 3: Right click and open the properties for the collection
Step 4: Select the Definition tab
a) Verify the jobs that were traced
b) Verify the type of heap events that were captured

Step 5: Right click on the collection, choose Analyses, then choose the Run Heap Storage

Step 6: Take the defaults and press OK on the PEX Analysis Time Filtering

Step 7: Wait for the analysis to complete
Step 8: Open the Heap Storage Folder, then Detailed reports. There are two reports of interest:
a) Heap memory leak call stacks (example below)
b) Heap memory leak call stacks ordered by size (example below)

Step 9: Review the reports
a) Heap memory leak call stacks
This report shows the number of heap allocations that were allocated and not deallocated during the trace. This report is ordered in descending order by count of allocations not freed by call stack.
- Allocations not deallocated - Count of events where heap was allocated and not deallocated
- Bytes not deallocated - Total bytes allocated and not deallocated
- Average size - Average size of the allocation
- Call level, Program Library, Program name, Module library, Module name, Offset, Procedure - The call stack of up to 16 levels that allocated the heap that was not released during the trace.
So, in this case we can see that the 16 levels of call stack with program QZSHSRV1 at level 5 allocated 4,275,048,448 bytes during the trace. This call stack was responsible for 1,043,713 heap allocations that were not freed during the trace. The next step would be to report this call stack to the owner of that program. The program owner in this case is IBM.

b) Heap memory leak call stacks ordered by size
This report shows the number of heap allocations that were allocated and not deallocated during the trace. This report is ordered in descending order by bytes not freed by call stack.
- Allocations not deallocated - Count of events where heap was allocated and not deallocated
- Bytes not deallocated - Total bytes allocated and not deallocated
- Average size - Average size of the allocation
- Call level, Program Library, Program name, Module library, Module name, Offset, Procedure - The call stack of up to 16 levels that allocated the heap that was not released during the trace.
So, in this case we can see that the 16 levels of call stack with program QZSHSRV1 at level 5 allocated 4,275,048,448 bytes during the trace. This callstack was responsible for 1,043,713 heap allocations that were not freed during the trace. The next step would be to report this call stack to the owner of that program. The program owner in this case is IBM.

[{"Line of Business":{"code":"LOB57","label":"Power"},"Business Unit":{"code":"BU058","label":"IBM Infrastructure w\/TPS"},"Product":{"code":"SWG60","label":"IBM i"},"ARM Category":[{"code":"a8m0z0000000CI9AAM","label":"Performance->MustGather"}],"Platform":[{"code":"PF012","label":"IBM i"}],"Version":"All Version(s)"}]
Historical Number
587269612
Was this topic helpful?
Document Information
Modified date:
15 June 2021
UID
ibm16463463