News
Abstract
The following updates will be available in release 2.0.63 SC of Planning Analytics.
Content
The following new features are available in Planning Analytics Workspace.
You must use the Planning Analytics Workspace new interface, which is also referred to as New Experience, to rename the database. This functionality is not available in the Planning Analytics Workspace Classic.
The rename process affects a database in the following ways:
- The database name is changed in the user interface.
- The database directory in the prod directory is renamed with the new name.
-
The database name in the tm1s.cfg file is updated to match the new name.
-
Any ACL files provided by the customer are updated in our repo if it includes the folder that was just renamed.
-
If the directory rename cannot succeed, the whole process is canceled, any actions are reverted, and an error message is presented to the user.
- Log on to Planning Analytics as an Administrator.
- On the Welcome page, click Administration.
- Click Databases.
- On the Databases panel, locate the database that you want to rename, and click its name.
- On the Details tab, check the database status. If the status is Started, click Stop.
The database must be stopped before it can be renamed. It might take a few minutes to stop the database. When the process is complete, the database icon changes to indicate the status . You can now proceed with renaming the database.
 - Next to the database name, click the Rename database icon
 .
.
The current database name is highlighted. - Overwrite the current database name with the new name, and click the Save (check mark) icon to proceed with rename process.
The rename process might take several minutes to complete. When it's finished, the new database name is displayed in the Databases panel.
Planning Analytics on Cloud administrators can remove users in Planning Analytics Workspace Administration without using IBM Subscriptions Management (SSM).
Administrators remove users only from the primary tenant (environment), and the system then removes the users from all secondary tenants (environments). The users are also automatically removed from SSM, from groups that they were members of, and from all environments that they were associated with. The removed users' personal assets are moved to a new folder named Unknown , but their shared assets remain in the shared folder.

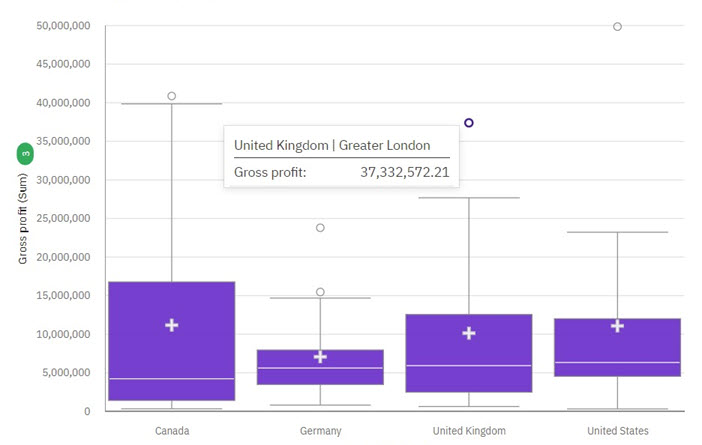
You can create a box plot to show the median, quartiles, and outlier and extreme values for a variable. The inter-quartile range is the difference between the 75th and 25th percentiles and corresponds to the length of the box. The middle line is the 50th percentile.
Above and under each box, 'whiskers' give additional information about the spread of the data.
Far out values are represent by adding "o" signs beyond the whiskers.
The mean score in a box plot is presented by a "+" sign.
Use the Key field in a box plot visualization to determine the items for which you want to identify outliers and compare distributions.
This box plot example shows the gross profit statistics for various markets.
You can now use the CreateFromCVS API method to generate a new Exploration View or Quick Report using a common view specification (CVS).
A common view specification is JSON that is composed of two major parts; the MDX query and a sidecar for additional state information. Data driven mechanisms, such as TurboIntegrator, are only concerned with the MDX query. However, user interfaces will also consume the sidecar to ensure presentation consistency.
For more information, see CreateFromCVS (Exploration View) and CreateFromCVS (Quick Report).
To learn more about Common View Specifications, see Common View Specification.
Conformance compatibility update
The 2.0.63 update of Planning Analytics for Microsoft Excel is not compatible with the current release of Cognos Office Connection. Users that use both Planning Analytics for Microsoft Excel and Cognos Office Connection are affected in their ability to upgrade to the latest release of Planning Analytics for Microsoft Excel.
Users who utilize either Cognos Office Connection or Planning Analytics for Microsoft Excel on their own can continue using the latest releases of each. Users who utilize both Planning Analytics for Microsoft Excel and Cognos Office Connection for their reporting needs can continue using Planning Analytics for Microsoft Excel 2.0.62 alongside the latest release of Cognos Office Connection.
In an upcoming release, the Planning Analytics add-in will be converted from an installer-based delivery to a single file a fraction of the size. This will provide easier self service in enabling and disabling the add-in. Shortly following this upcoming release, Cognos Office Connection will enable the link between the two products once again.
Planning Analytics SC 2.0.62 introduced the ability to retrieve data from multiple TM1 databases in a websheet, but imposed two limitations:
- all databases referenced in a websheet had to be registered on the same Admin host
- you could use multiple TM1 databases in a websheet only on Planning Analytics Local
To successfully reference multiple databases in a websheet:
- Database names must be static; computed database names are not supported.
- All databases must be configured to use the same authentication mode.
- Users must have common credentials across databases.
Was this topic helpful?
Document Information
Modified date:
30 April 2021
UID
ibm16441053