Technical Blog Post
Abstract
Rebuilding - What's the impact
Body
In my last post I said that if you need the maximum IO/s or bandwidth from your system then you are in trouble. Hardware failure is going to stop you achieving that maximum and hardware failures will happen. The most common that you are likely to encounter is a drive failure, for some customers they have so many drives in their estate that they see multiple failures a week, for others they may go a whole year without seeing one. I was told the quick rule of thumb is 1 failure per 1000 drives per month.
Our test team ran over 100 different rebuild performance tests, in some cases it was to show improvements or changes from different code levels so I've selected a few to show you all based on the 7.7.1 code stream (which was released about a week ago). This includes some performance improvements as Distributed RAID became multi-threaded (hopefully killing the idea that you need to have 4 arrays for optimal performance for good!) and a couple of changes to how we balance rebuild, which I'll explain in more detail towards the end of the post.
Before I begin I should point out that these tests were run on range of clusters, some were performance clusters borrowed from the performance team and some were clusters that had been used for functional testing, and in most cases we had to scrounge round looking for enough drives of the same type, so this is not a performance showcase where we have used fully optimized configurations with the fastest drives possible. As always with a similar setup you may see slightly better or slightly worse performance.
In all cases we have made sure that the drives were the limiting factor in the performance run. Most of the official data we share about performance, we've made sure we had plenty of drives so we hit bottlenecks elsewhere and if we ran a rebuild on some of those configurations you wouldn't be able to tell a rebuild had happened. I'm sure there will be competitors out there with charts showing zero impact of drive failures, that typically means they have some horrific bottleneck elsewhere in the system that stops them maxing out the drives to start with, or they threw huge number of drives into the stand, or maybe in some cases the rebuild is running so slowly that it may never complete.
So onto the graphs...
10k Enterprise Drives
Let's start with a fairly standard Distributed RAID array. Some half terabyte 10k rpm enterprise drives doing fairly typical workload:

The top graph shows the cache fullness in yellow and the IO rate in blue. The rebuild starts at around the 30 minute mark, so the first half an hour is just getting into a steady state, cache is holding pretty level at 70% which is what it's designed to do (as this is a 70% read workload the IO/s is limited by the read response time rather than the write response time hence cache not hitting full). You can see as the rebuild starts the read latency and write latency increase and then over time it drops back down. The rebuild finishes at about the 220 minute marker so a little over 3 hours in total.
One thing I should point out is that this is using a performance tool that is freely available (but I don't know if I can name it or not so I'm not going to), before running the test we found out what IO rate it could achieve we then lowered the number of threads it could use till we worked out the minimum needed to achieve that rate. If we had run the same test with a thread setting of 2000 the top graph would look almost identical, the bottom graph would look horrific as the tool just keeps throwing more and more io trying to reach the desired IO rate. This is probably the most common performance testing mistake, if a system is not getting the desired IO rate throwing more IO at it is unlikely to do anything except increase latency.
That was a 100% IO rate test, the system wont handle any more IO so if this was your cluster, your application now has a deficit. As the latency increase was fairly small, hopefully users didn't notice anything, but at some point that deficit is going to be a problem, hence why having a system that needs to run at 100% constantly is a bad idea.
SSDs
The next graph is an SSD example, in this example the system is being asked to do 50% of what we measured the config capable of.
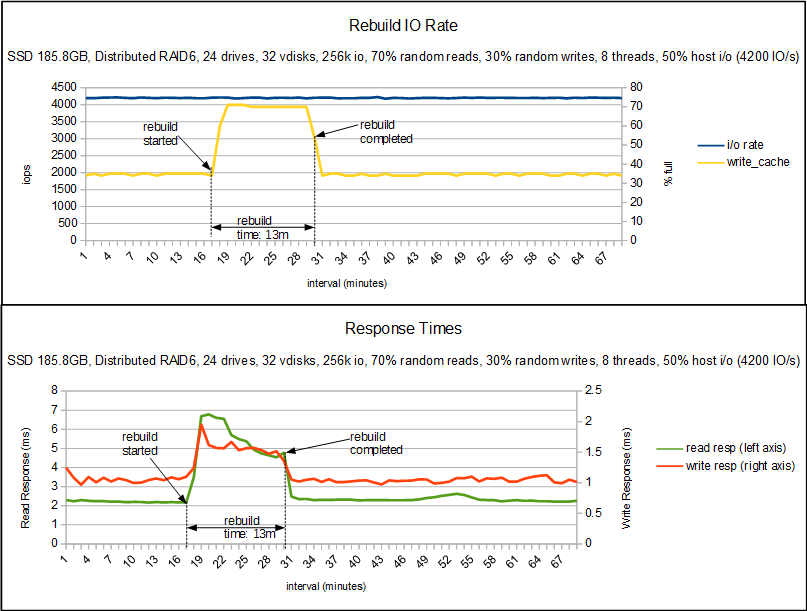
The top graph again shows cache fullness and IO rate, in this case cache wasn't being taxed at all before the rebuild so sat at 35%. You can see that in the 13 minutes that the rebuild took the IO rate didn't drop and cache only rose to 70%. The bottom graph shows that latency did increase, these are SSD drives so we were already looking at very low latency so they are still going pretty quick. For a hyper sensitive host application that increase may have been too much but I would hope most applications wouldn't notice those levels especially for only 13 minutes.
Nearlines and Double Failures
Now onto the nearlines, this first set of graphs I wasn't going to include as it is really boring but it helps explain the next set a bit.

So I've moved up from a 50% usage to 70% as that is a more sensible utilization to be at (finding time on the SSD stand was hard, so I didn't have many to chose from, hence only using 50%). So you can see with some fairly large 3.5TB drives the rebuild can take a while (although compared to non-distributed arrays where the rebuild can take days this is a huge improvement). The top graph shows that it took us a long while to reach the steady state where we were able to start the tests and then is generally pretty boring, the IO rate stays constant and cache seems a little more agitated but is generally keeping in the 70-72% range.
The bottom graph shows write response pretty much constant, thanks to cache, while the read response time does increase. Reading from drives that are carrying out a rebuild takes longer, it's rather unavoidable. But again hopefully you can see that we've maintained the desired IO rate and the latency hasn't gone up ridiculously.
For my final graph things get a bit complicated, one of the advantages of RAID6 is being able to support a double failure, and one of the improvements we put into the latest code is to vary our rebuild rate based on the number of rebuilds happening in an array. So in this experiment 3 drives in total were failed.

So this is the same workload as before as you can see the 1st rebuild starts and everything looks good, the write response time has increased so little that you can't see it on the graph. Read response time has roughly doubled. Then about 30 minutes later we fail a second drive. What happens now is that the rebuild rate increases dramatically, and as a result cache fills up and the write latency jumps up to roughly 1 second. The system is trying it's hardest to prevent data loss and as a result the host is being impacted, it's IO rate has nearly halved. But what we can see is that a rebuild that took over 10 hours in the previous test has completed in only 6 and a half. And so when that third failure comes in the array has the redundancy to cope (in this test it was programmed to fail a 3rd when the first completed, it wasn't just amazingly well timed). We then complete the 2nd rebuild, at that point the rebuild rate drops and so the 3rd rebuild takes longer, and the write latency has smoothed out.
If you look at the IO rate chart you can see that the tool we were using knows about the deficit that was created, so when the 2nd rebuild completes it starts throwing more IO down so by the end of the 3rd rebuild it has increased to over 2500 IO/s compared to it's target of 2100 IO/s, it's that extra workload that is managing to keep the cache full hence the increased write latency. If we had used a test tool that didn't try to recoup that lost IO then it would have dropped back to the same levels we see in the single rebuild test. When the 3rd rebuild completes you see another burst of work from the host which quickly gets rid of the rest of that deficit that had built up.
As I said, this ability to reduce the rebuild rate on a single failure is new to 7.7.1 and is specific to distributed RAID6, RAID5 doesn't have the luxury of a second set of parity drives so can't afford to take it easy and has to drive as hard as it can. Traditional RAID also doesn't get this benefit. Typically the drive that is being rebuilt to is the limiting factor and with the large drives we have to go as hard as that drive can stand if we want to avoid data loss from further failures.
Closing Thoughts
I'm hoping that these charts help you to understand how rebuild impacts the performance characteristics of a system. As I said at the start drive failures are the most common hardware failure in the field so not anticipating them could be a huge mistake. I'm also hoping that this might encourage more customers to pick up distributed RAID 6, I'm still seeing a lot of customers using choosing RAID 5 which I'd suggest only using for enterprise SSDs, the capacity of everything else means RAID 6 should be your first choice.
There is a new Redbook planned where we will talk about distributed RAID in a little more detail than the last, covering best practices and looking at performance in more depth. We might even get a red paper out that goes into this in a bit more detail.
UID
ibm16164229