Troubleshooting
Problem
During the nightly autoupdate config deploy, the Events Per Second (EPS) rate is observed to temporarily display zero in the "Event Rate (EPS) (Count) (Events per Second Raw- Average 1 Min)" dashboard graph.
Symptom
The Event Rate (EPS) (Count) (Events per Second Raw- Average 1 Min) Dashboard graph can be seen with results similar to:
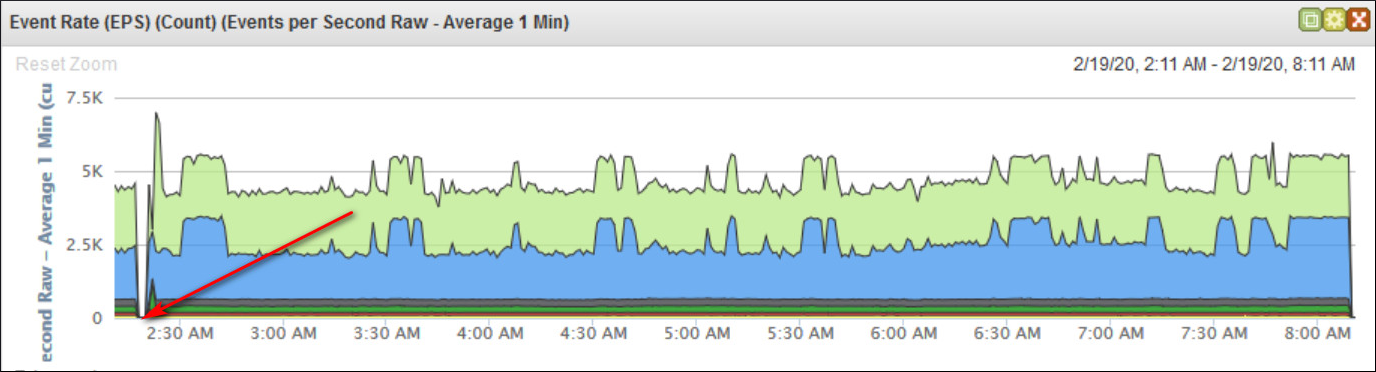
Zero events are displayed in the graph when the ecs-ec service is restarting. The 7.5k EPS spike, in the chart afterwards, is where the ecs-ec-ingress spools events to ecs-ec. The accumulator service, which allows the creation of graphs, is also being restarted during the config deploy action.
Document Location
Worldwide
[{"Type":"MASTER","Line of Business":{"code":"LOB77","label":"Automation Platform"},"Business Unit":{"code":"BU048","label":"IBM Software"},"Product":{"code":"SSBQAC","label":"IBM Security QRadar SIEM"},"ARM Category":[{"code":"a8m0z000000cwtNAAQ","label":"Deployment"}],"ARM Case Number":"","Platform":[{"code":"PF016","label":"Linux"}],"Version":"All Version(s)"}]
Log InLog in to view more of this document
This document has the abstract of a technical article that is available to authorized users once you have logged on. Please use Log in button above to access the full document. After log in, if you do not have the right authorization for this document, there will be instructions on what to do next.
Was this topic helpful?
Document Information
Modified date:
27 May 2021
UID
ibm15737809