Question & Answer
Question
How do you import and combine two spreadsheets in IBM Cognos Insight?
Cause
The following is a use case with detailed steps on how to import and combine data from two spreadsheets. Two Excel spreadsheets are attached below which you can use to follow along with the steps.
In the following example we will import data from two separate spreadsheets that we would like to combine into one data source for analysis. In this case, one file contains employee capability data and the other has the employee's skill level. The only common data between the two data sets is SNUM, which is the employee serial number. By combining these two data sets, we can see which employees have which capabilities and at the same time how their skill level is rated.
We will create a new cube based on the two underlying cubes created during the import of the spreadsheet data and use cube rules to define how the count measure of the new cube should behave based on the underlying data.
Since the spreadsheet files contain simple data that can be easily consumed by Cognos Insight, we will use the Quick Import method.
1. Open Cognos Insight, from the toolbar, click Get Data, and then click Quick Import.
2. In the Open window, navigate to EmplCapability.xlsx file provided with this document, and then click Open.
The data is imported and a default crosstab and chart are displayed. We will edit the layout to get a better understanding of the data.
3. From the widget toolbar, click the Change Display button, and then click the Crosstab option.

4. Drag Total of Capability Title to the Columns section of the widget.

5. If necessary, re-size the column headers so the are visible.

- We will now import the second data source.
7. In the Open window, navigate to the EmplLevels.xlsx file provided with this document, and then click Open.
8. From the widget toolbar, click the Change Display button, and then click the Crosstab option.
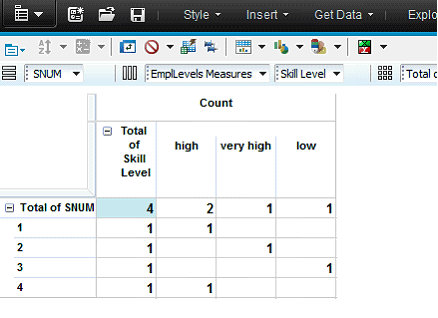
9. Drag Total of Skill Level to the Columns section of the widget and, if necessary, re-size the headers so they are visible.
10. In the top right corner, click Restore this Widget.

- This reduces the size of the widget window and allows we to also see the widget created earlier. We can re-size and arrange the widgets to make them both clearly visible.

We can now see the data we are interested in from the two different cubes. In the top cube we can see which employee serial numbers (under Total of SNUM) have which capabilities and in the cube on the bottom, we can see which employee serial numbers have low, high, and very high skill level ratings. However, we would like to consolidate this data into a single view. To do so, we will create a new cube and add some of the existing dimensions from these cubes to it.
11. In the top right corner of the window, click the View content pane button.

The Data pane appears.
13. Rename New Cube to Emp Capability by Skill.

14. Expand All Dimensions, multi-select SNUM, Capability Title, and Skill Level and drag them to the Emp Capability by Skill cube.
- An Add Dimension dialog appears asking if we would like to share the dimensions or duplicate them.
- The dimensions appear in the new cube.

- We do not need New Dimension A and New Dimension B as these are template dimensions when creating a new cube.
17. Under the All Dimensions folder, multi-select New Dimension A and New Dimension B, press Delete on the keyboard, and then click Yes in the Delete Unused Dimensions dialog.
18. Under the Emp Capability by Skill cube, expand Measures and rename Value 1 to Count.
19. From the Data pane, drag the Emp Capability by Skill cube onto the workspace.
20. In the new widget, drag Total of Capability Title to the Rows section and Total of Skill Level to the Columns section.
21. Re-size the row and column headers so they are visible and display only the Crosstab using the Change display button.

- The capabilities and skills now appear on the rows and columns respectively, but the count values must be derived where matches exist in the underlying cubes. To do so, we will define a cube rule to populate the cell values.
23. In the Cube Rules window, expand the #Region System section, highlight the entire section being sure NOT to highlight UNDEFVALS, and then press Delete on the keyboard as we do not need these declarations for the purposes of this workshop.
- We will only be left with the UNDEFVALS; declaration.

- In the next steps we will write the syntax for the cube rule. Be sure to only type in the bold items and not any non bold punctuation. The screen capture after step 33 illustrates what the final syntax should look like.
- The expression now looks like this.

25. At the end of the expression, type = N:IF( , and then press Enter to go to the next line.
26. On the next line type ISUNDEFINEDCELLVALUE(DB( .
- Once we type the open bracket, again a syntax completion drop down appears allowing we to select a cube name.
27. From the syntax drop down, select 'EmplCapability', an then press Enter.
- The cube name followed by a comma is entered.
- The expression now looks like this.

29. After the comma, type ! , and then select !Capability Title .
30. After the comma, type ' , and then select 'Count' .
- A closing bracket is automatically added at the end of the expression.
31. At the end of the expression, type ) = 0 & , and then press Enter to go to the next line.
32. Using the same technique with the syntax completion to create the first portion of the conditional expression, create the following syntax:
- ISUNDEFINEDCELLVALUE(DB('EmplLevels', !SNUM, !Skill Level, 'Total of Country', 'Total of Unit', 'Total of Job Role', 'Count')) = 0
- The expression now looks like this.

- We will look at the rule starting from the inside out to see what the expression is doing.
DB('EmplCapability', !SNUM, !Capability Title, 'Count') evaluates the intersections in the EmplCapability cube for each of the dimensions and the measure, in this case SNUM, Capability Title, and Count.
DB('EmplLevels', !SNUM, !Skill Level, 'Total of Country', 'Total of Unit', 'Total of Job Role', 'Count') does the same thing but in this case, since the Country, Unit, and Job Role dimensions are not present in the Emp Capability by Skill cube, the intersections always evaluate at the highest level for these dimensions, hence Total of Country, etc.
The ISUNDEFINEDCELLVALUE function for the ISUNDEFINEDCELLVALUE(DB('EmplCapability', !SNUM, !Capability Title, 'Count')) = 0 expression returns 1 if the passed value equals the cube's default value, in this case empty, otherwise the function returns 0. If there is no match (the intersection is not empty in both cubes), then we want to populate a value for the Emp Capability by Skill cube's intersection.
The final piece is the IF function which says if the condition is true for both underlying cubes (both have a value at the intersection), then populate the Emp Capability by Skill cube intersection with a count value of 1, otherwise STET, which means do nothing and leave the cell value as empty.
- If we receive an Invalid rules message, click Yes to save the invalid rules so we can go back and edit the rule to correct the syntax, otherwise we will have to start from the beginning.

- The cells in the Emp Capability by Skill cube now have values which are derived from the underlying cubes.

Using a new cube and a cube rule, we were able to populate data from two underlying cubes into a consolidated view.
If you are working with larger data volumes with a lot of sparse data, you will want to use Feeders statements in one of the underlying cubes to improve performance. More information on Feeders can be found here: http://www.ibm.com/developerworks/data/library/cognos/financial_management/analytics/page620.html.
Was this topic helpful?
Document Information
Modified date:
15 June 2018
UID
swg21957773