Troubleshooting
Problem
Dashboards and Reports created with searches that use unique counts can display results that are different than what is displayed for the same search run in Log Source activity. Dashboard results over longer periods display values lower than values over a more recent time period.
Symptom
To reproduce this issue.
- Click Log Activity tab.
- Click New Search.
- Enter a Specific Interval with Start and End Time.
- Scroll to Column Definitions.
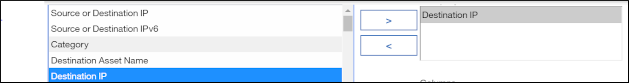
- Create a search that has a Group By: filter.
- Click Search.
- Click the Gear on the completed search and select a filter with a Unique Count enabled.
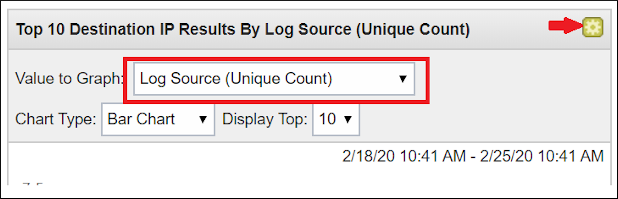
- Click Save Criteria.
- Add a Search Name.
- Add it to an Assigned Search.
- Click Share With Everyone
- Select the Include in my Dashboard checkbox.
- Click Dashboard tab.
- Click Add Item > Event Searches > Your saved search Dashboard.
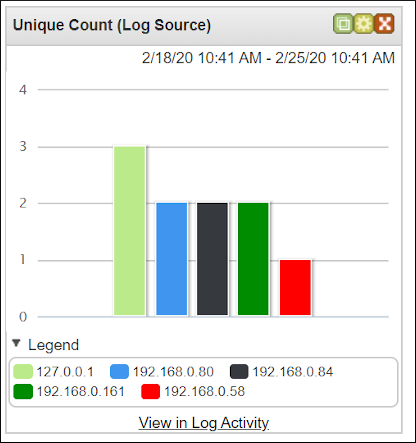
- Click View in Log Activity.
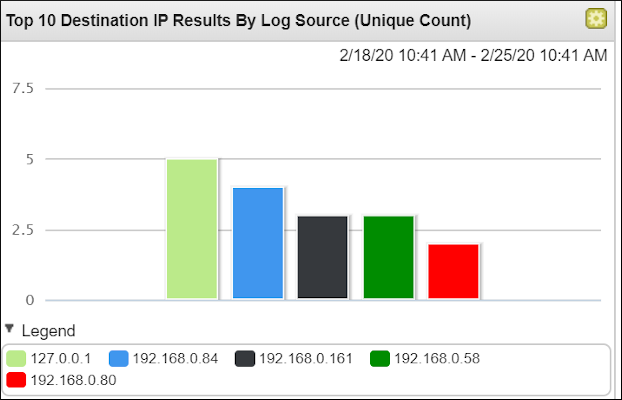
Results
The Graph is different than the one on the Dashboard
Document Location
Worldwide
[{"Business Unit":{"code":"BU048","label":"IBM Software"},"Product":{"code":"SSBQAC","label":"IBM Security QRadar SIEM"},"Component":"Dashboard","Platform":[{"code":"PF016","label":"Linux"}],"Version":"7.3","Edition":"","Line of Business":{"code":"LOB77","label":"Automation Platform"}}]
Log InLog in to view more of this document
This document has the abstract of a technical article that is available to authorized users once you have logged on. Please use Log in button above to access the full document. After log in, if you do not have the right authorization for this document, there will be instructions on what to do next.
Was this topic helpful?
Document Information
Modified date:
11 January 2021
UID
ibm13380097