Question & Answer
Question
Why is my QFlow not displayed in my Dashboard?
Answer
To display a dashboard widget an ECS-EP service is required. QFlow and Event Collectors lack this service and cannot be used individually as Dashboard widgets. In the example below, this deployment consists of a 3100 Console, 1601 Event Processor, a 1701 Flow Processor, a 1501 Event Collector and a QFlow.

Fig 1: Host Table from System and License Management containing a QFlow and 1500 Event Collector.
When you look at the Dashboard for Event Rate (EPS), you see Event Processors and Event Collectors. The Data for Event Collection is actually coming from data provided by the Event Processors, there is no ECS-EP process to get statistics.

Fig 2: Event Per Second for a Flow Processor, Event Processor and a QFlow.
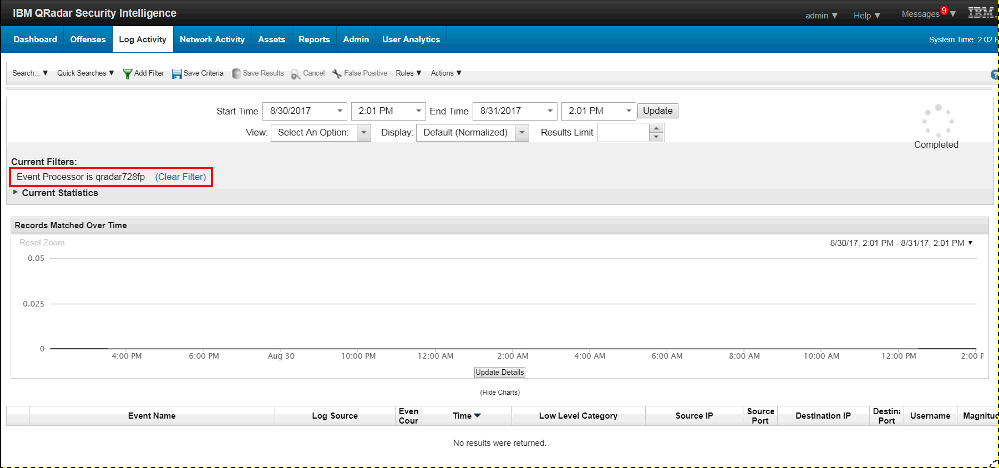
Doing an Event Processor search in Log Activity lets you add a Flow Processor, but will show no results. Since Flows are measured in Flows Per Minute, they will not show in the EPS graph for Event Processors.

Fig 3: Event Search containing a Flow Processor.
In the same way, our 1501 Collector does not have an EPS-EP component, the QFlow is the same way. It relies on the Flow Processor to get statistics. In order to create a dashboard widget, you need to be able to search on data and group it by a column. To get a QFlow to be displayed, you would need to create a search involving Flow Sources and then group by that field.
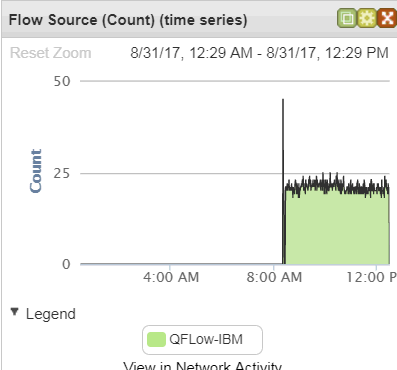
In this example, we did a simple search were we looked for a single flow source and used it in a time series search over a period of 6 hours.

Fig 4: Flow Source as displayed by Flow Processor component.
Creating a Saved Search and Dashboard Widget
- Click Network Activity.
- Click Search > New Search
- Under, Search Parameters click Flow Source
- Click Match Equals or Equals any of
- Add the Values for the QFlows
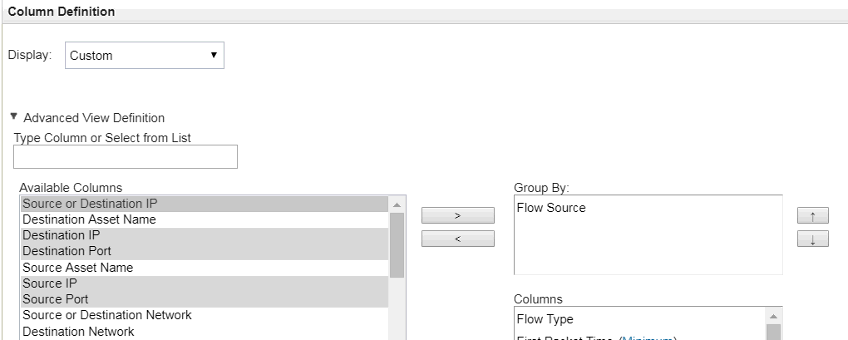
- Under, Column Definitions remove Flow Sources from Columns and add to Group By
 |
| - Click Filter
- Click Save Criteria
- Add a Search Name > Recent time period > click Include in my Quick Searches > click Include in my Dashboard. Note: In this Example we used Flow Source.
- Click Save.
- Click Dashboard > Show Dashboard System Monitoring.
- Click Add Item > Network Activity > Saved Search from step 9.
- Click on the Gear to adjust the properties.

Results: You have a Dashboard widget for your monitoring QFlow's.
Where do you find more information?
Was this topic helpful?
Document Information
Modified date:
08 February 2019
UID
swg21998135