Question & Answer
Question
For a running system where can I find the relevant system logs for tracing system’s health?
Cause
Need to check system’s health, track system’s specific behavior or need to provide logs to IBM.
Answer
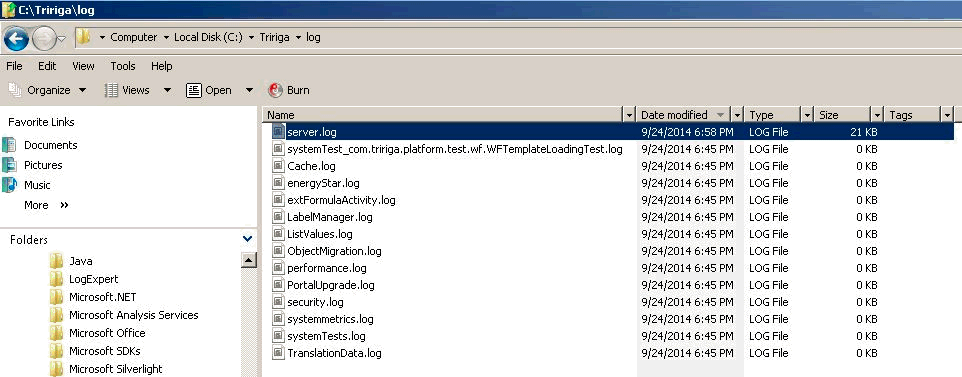
IBM TRIRIGA logs can be found on <TRIRIGA Install>/log folder for each one of your servers / installations:
The server.log file is the most important log for tracing system’s health.
The performance.log file will contain performance relevant information when you set Platform Logging parent category Performance Timings. It will contain the start time an end time of lots of system’s processes and some additional information for them. When you activate “Performance Timings” this may slow down your system for the addition IO workload necessary for the logs. This is typically used for tracing behavior on a lower environment (sand-box or testing environment) or for very specific and temporary usage on Production (it needs to be deactivated as soon as the data gathering is performed).
The security.log file will contain information about system’s login tries, like login attempts, status and security token messages.

If you are using IBM WebSphere as your Application Server product solution, you will be able to find its logs on the folder “…ibm\websphere\appserver\profiles\<profilename>\logs\<servername>” for each one of your application servers (JVMs).
The IBM WebSphere SystemOut,log file will contain the most relevant information for system’s health from Application Server perspective. It is rolled out in daily basis, so you will see the previous history logs with this name formatting: SystemOut_YY.MM.DD_HH.MM.SS.log
The IBM WebSphere SystemErr.log will contain relevant messages printed out by Application, typically regular operation warn and error messages, the most of them will not show up on SystemOut.log file.
The IBM WebSphere native_stderr.log may contain the JVM Garbage Collection run information history, useful when tracking system’s performance and Out-of-Memory issues. This will only be recorded on this log if "Verbose garbage collection" field is check marked on WebSphere Admin Console -> Application Servers -> <Your Server> -> Process definition -> Java Virtual Machine.

If you are using Oracle BEA WebLogic as your Application Server product solution, you will be able to find its logs on the folder ”bea\user_projects\domains\<domainname>\servers\<servername>\logs\
<servername>.log” for each one of your application servers (JVMs).
If you are using JBOSS as your Application Server product solution, you will be able to find its logs on the folder ” $JBOSS_HOME/server/default/log” for each one of your application servers (JVMs).
Was this topic helpful?
Document Information
Modified date:
17 June 2018
UID
swg21685463