To understand CPU Memory Affinity the mpstat command is useful but some terms/stats are not described at all - here we full that gap.

I just realised that I got help from the AIX developers to explain the output of the mpstat -d command for my POWER and Affinity Technical University sessions in Miami and Copenhagen that I never passed on to every one. In an earlier blog, we examined some mpstat columns but skipped others.
The nearly undocumented mpstat stats are: S0rd, S1rd, S2rd, S3rd, S4rdand S5rd. In the AIX manuals it states:
- S0rd = The percentage of thread re-dispatches within the scheduling affinity domain 0.
And likewise for the other numbers - but what does domain 0 to domain 5 mean? They are unexplained.
This is what I was told - re-dispatch means that a process is started ideally on the same thread on same CPU core on the same POWER chip within the same Multi-chip module (if you have them) on the same CEC as last time for efficiency - its data is likely to be cached near by. A process is always assigned a home CPU core and its memory is allocated on the memory attached to that CPU core, so the idea situation is that it is running on that home CPU core.
The
S[0-5]rd stats tell you how often the idea is being achieved of how far from perfect it is
- S0rd – same Logical processor/CPU core thread (SMT)
- S1rd – same CPU Core
- S2rd – only used in machines using an MCM like the Power 775 - I have not got one so I can't confirm this.
- S3rd – same POWER chip
- S4rd – same CEC
- S5rd – other CEC
So 100% S0rd is perfect but also high percentages of S1rd are good too as the CPU core threads share the L3 cache.
Let us look at a few samples:
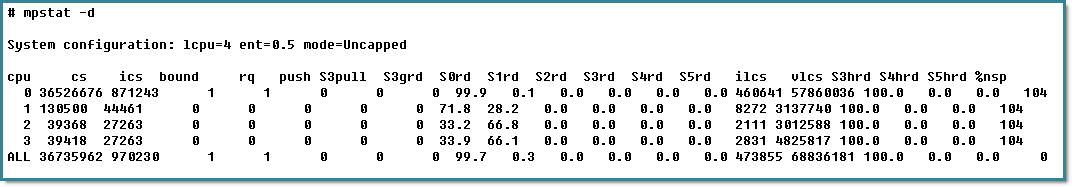
From a small virtual machine that has been running only a few days - this is the output from mpstat -d (with no other options so gives you the summary only):
Conclusions - it is a right mess as the columns are not aligned. So I fixed that by hand and get:
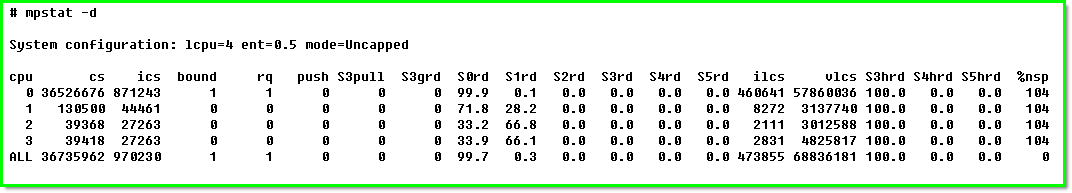
We see the logical CPU zero (cpu 0 row) and s0rd column is 99.9% = meaning 99.9% of the time is managed to run the process on the same thread - which is excellent good. But we can see the the other logical threads 2 to 3 have higher S1rd numbers 28.2% to 66% and this shows that a lot of the time the SMT threads are getting shut off and the processes are having to run on another thread - this is all working as normal as threads get shut down when the are not needed to got the few remaining running threads a higher percentage of the processor internal units.
Also not the threads are not evenly user - this can be seen because the voluntary logical processor context switches (vlcs) stats. These are the count of the times the virtual machine yields the processor to another LPAR as it has nothing else to run. The involuntary logical processor context switches (ilcs) are the times the Hypervisor stopped the LPAR running as it reached its entitlement. These numbers are much higher on the logical CPU 0 showing that it was running more often. We have to look at these columns as logical CPU 0 is running roughly 20 times more often than logical CPUs 1 to 3 so we have to allow for that in the s0rd to s5rd stats - i.e. the 99.9% is 20 time more significant.
We do not see anything in the s2rd to s5rd columns because we only have 1 physical CPU core.
By the way the %nsp is 104 showing I have 4% over-clocking. My LPAR is not that busy but other LPARs on the machine are and this puts this POWER7 CPU into "favour performance" mode.
The above was a tiny virtual machine and only one processor. Below is a slightly larger one from an machine many months in to running IBM Web Application Server and Oracle RDBMS on a 20 Virtual Processor machine with SMT=4 so 80 logical CPUs on a large Power 795.
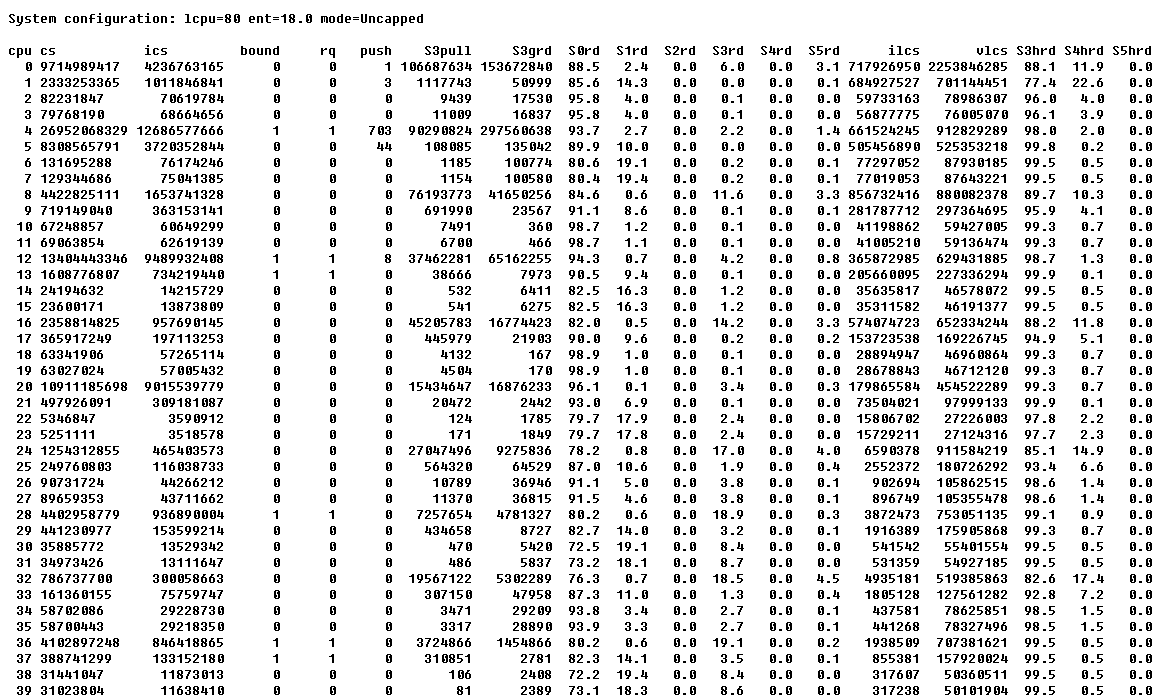
I added the second header column at the bottom to save having to scroll back and forth.
This is much more interesting and complex. We can clearly see the logical CPUs come in groups of four (the four threads on one POWER CPU core) as every fourth logical CPU has larger numbers. As SMT switches off the other three threads in favour of the first for efficiency - when there is only one running program. We can also see percentages in the S0rd, S1rd, S3rd and S5rd columns showing that processes could not be rescheduled on the perfect home thread or core but further away. Even then the bulk are re-dispatched perfectly on the home thread and core. Also note the lower down (higher numbered) logical CPUs are not being used much at all - probably rarely in occasional peaks - this virtual machine is having its virtual processors folded away for long periods - we should consider reducing the VP count. If we get lucky this will mean the LPAR is better placed in the machine with more CPU and memory local.
Logical CPUs 72 to 75 are hardly used at all! But the last four logical CPUs = the last physical CPU is busier - I have seen this before - I suspect the last CPU is being used for interrupt handing and this nicely separated the interrupt handlers from the user processes and means less interrupting of user code.
Note the
S3hrd,
S4hrd and
S5hrd columns (see previous blog entries for more on these as they relate to local, near and far memory accesses via SRAD's) roughly match the domains in the columns we are looking at (
S0rd to
S5rd) but show a different view - instead of the how often the process gets to run in the right place it the
S[3-5]rd stats show how often this logical CPU is running process that should be running further away i.e. how often this logical CPU is having to help out another logical CPU from further away in the machine. If you add up:
- S0rd + S1rd + S2rd + S3rd
then you get something similar to the concept of Near processor reported in the
S3hrd column which will then probably require access to memory that is further away.
We could write a book about the other columns in mpstat -d but at least I hope we have explained the mystery columns and the domain numbers.
Other places to find content from Nigel Griffiths IBM (retired)
[{"Business Unit":{"code":"BU058","label":"IBM Infrastructure w\/TPS"},"Product":{"code":"SWG10","label":"AIX"},"Component":"","Platform":[{"code":"PF002","label":"AIX"}],"Version":"All Versions","Edition":"","Line of Business":{"code":"LOB08","label":"Cognitive Systems"}},{"Business Unit":{"code":"BU054","label":"Systems w\/TPS"},"Product":{"code":"HW1W1","label":"Power -\u003EPowerLinux"},"Component":"","Platform":[{"code":"PF016","label":"Linux"}],"Version":"All Versions","Edition":"","Line of Business":{"code":"","label":""}},{"Business Unit":{"code":"BU058","label":"IBM Infrastructure w\/TPS"},"Product":{"code":"SWG60","label":"IBM i"},"Component":"","Platform":[{"code":"PF012","label":"IBM i"}],"Version":"All Versions","Edition":"","Line of Business":{"code":"LOB57","label":"Power"}}]