Technical Blog Post
Abstract
Performance: Maximo Activity Dashboard (PerfMon)
Body
Maximo Activity Dashboard (PerfMon)
Overview:
The Maximo Activity Dashboard commonly known as PerfMon is available as a UI Interface from Maximo version 7 onwards. It is normally used when debugging performance related problems in Maximo.
Here are some of the capabilities of PerfMon –
- Provides information on Individual Request Processing Time on the server side including –
- Overall response time
- Average response time for similar kind of requests
- The navigation event that led to the request being made.
- Provides information on Maximo Business Objects (MBO) execution for each request including –
- Information about SQL requests – Total number, how many times, Actual execution time, ones that took more than 100ms and so on.
- Number of MBO’s generate for the UI request.
- For users running Oracle database the PerfMon can also show the Explain Plan for SQL execution that helps pinpoint “full table scans”.
Configuring:
Configuring the PerfMon monitoring tool is very easy. The following changes need to be made to the web.xml file under –
<maximofolder>\applications\maximo\maximouiweb\webmodule\WEB-INF\
Uncomment or add the following section (if they did not exist) to the web.xml file.
Filter Definition:
<filter>
   <filter-name>PerfMon</filter-name>
      <filter-class>psdi.webclient.system.filter.PerformanceMonitor</filter-class>
   </filter>
<filter-mapping>
   <filter-name>PerfMon</filter-name>
   <url-pattern>/ui/*</url-pattern>
</filter-mapping>
Rebuild and redeploy the Maximo ear file following the steps at Rebuilding and Redeploying Maximo EAR File(s)
Important Note: To start using PerfMon rebuild the WebSphere EAR file and restart the Maximo Application Server.
Monitoring:
In order to view the Maximo Performance Monitoring Reports generated by the tool go to the Maximo application using the URL –
http://<hostname>:<port>/maximo/webclient/login/login.jsp
Using a separate browser session open the URL –
http://<hostname>:<port>/maximo/webclient/utility/profiler/PerfMon.jsp
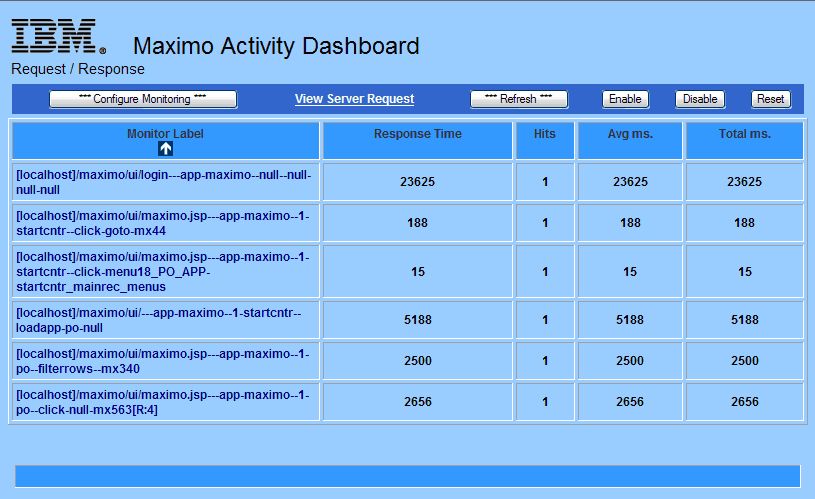
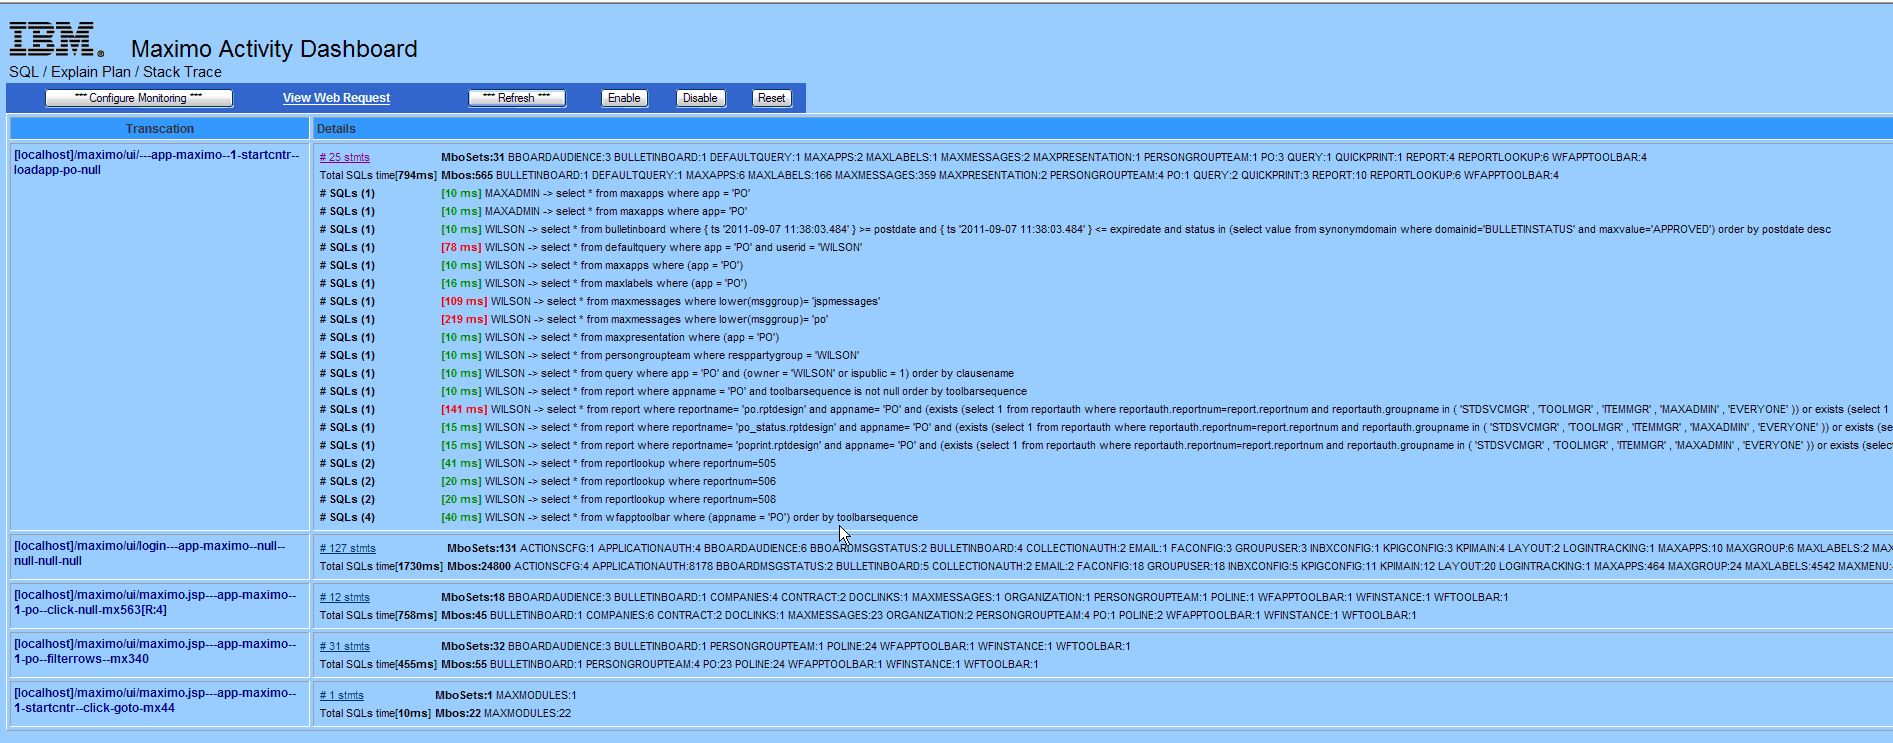
You should now be able to see the Maximo Activity Dashboard with information on the requests made to the server side along with the Response Times. Clicking on “View Server Request” will give you more information on each request (SQL time, Mbo counts, Stack Trace etc.)
UID
ibm11133601