Technical Blog Post
Abstract
Maximo is a little slow. I need to look into this, but where do I start ?
Body
Looking in to a performance issue on a Maximo system is a complex thing. Performance of Maximo depends not only on Maximo, but also on WebSphere, a database, an operating system and a network.
In this blog I will concentrate on where to start looking into performance from a Maximo perspective. This may often point to other areas of the system that then also need to be reviewed.
I will try to detail below some basic questions to ask yourself (or whoever is reporting the problem).
I will also try to describe some basic non intrusive logging that should help identify areas to review.
I will point to the Performance Best Practices Guides, which are based on real life installations and will normally help with most performance issues.
I will also point to a tool that can investigate numerous Operating system/WebSphere/Database/Maximo settings that can adversely affect performance (and provide a nice colour coded graph).
I would say here that this is my normal approach to general performance issues as it provides a good overview fairly quickly. There are many tools and processes available to monitor and check on all parts of a complete system. This blog concentrates on what Maximo can give you with just a little effort which will hopefully point you in the right direction.
Step 1. Find out as much as you can at a high level of what 'slow' really means.
Often users will say the 'system' is slow, but what do they actually mean ?
Is the whole of Maximo slow or just one Application / action / function
Is it slow for everyone, or just for certain users – what is the difference between the users e.g. physical location / security groups / Application used / job function
Is it slow all of the time or only at certain times of the day, or at random times
When did it start becoming slow – after an install / upgrade / maintenance applied / additional users / added KPIs / added customisations / added workflows/automation scripts.
The answers to the above questions will often provide vital clues towards an area to investigate
e.g. The system slows for 10 minutes on every hour, then settles again. This would suggest something is affecting the system at regular intervals, so crontasks would be likely suspects.
Step 2. Set a few logging parameters that will help point out long running SQL, memory usage, MBO loading and users on the system.
Maximo root logger should be set to INFO for the following to work.
The following 3 settings can be found in the System Configuration application.
mxe.db.logSQLTimeLimit=1000
Will log all SQL statements taking longer than 1 second to run
mxe.mbocount=1
Will log MBO loading in memory at regular intervals
mxe.db.fetchResultLogLimit=200
Displays a stack trace for any process loading 200 or more MBOs then further stack traces at each extra 200 loaded
Setting the above will provides updates in the log similar to these
Memory statistics (logged at regular intervals)
–[4/16/11 16:39:59:933 EDT] 0000003f SystemOut O 16 Apr 2011 16:39:59:933 [INFO] BMXAA7019I - The total memory is 1631584256 and the memory available is 227070992
Look for gradually decreasing memory – possible leak
Look for jumps in free memory – probable garbage collection
Look for continually low available memory - could point to an under resourced system.
Slow running SQL (logged for any SQL that takes longer than the logSQLTimeLimit setting)
[1/20/14 7:00:38:003 GMT] 000000df SystemOut O 20 Jan 2014 07:00:38:003 [WARN] BMXAA6720W - USER = (MAXADMIN) SPID = (xx.xxx.xx.xx.39583.140120060787) app (null) object (PMSCSRVOFF) : select count(*) from pmscsrvoff where (statusdate >= '2013-11-28-07.00.33.487000') and (itemnum in (select pmsccatoffmap.offeringnum from pmsccatoffmap, pmsccatdata where pmsccatoffmap.itemnum = pmsccatdata.itemnum and pmsccatdata.itemnum = ‘WORKERS01' )) for read only (execution took 1589 milliseconds)
Look for the same SQL slow many times – Maybe badly coded or an extra index would help. There is some information to help in this area in the Performance Best Practices Guide
Look for generally high numbers on many varying SQL statements – Could be an indication that the database may need tuning, statistics need updating etc.
MBOs Loaded in memory (logged at regular intervals)
[10/30/13 18:12:30:184 EET] 00000042 SystemOut O 30 Oct 2013 18:12:30:184 [INFO] ACCOUNTDEFAULTS: mbosets (4), mbos (4)
[10/30/13 18:12:30:184 EET] 00000042 SystemOut O 30 Oct 2013 18:12:30:184 [INFO] ACTION: mbosets (113), mbos (218)
Look for high numbers (thousands), especially if they keep gradually increasing – could points towards a possible leak or maybe something just loading far too many MBOs
Users connected
10 Apr 2014 09:01:36:037 [INFO] [MXServer] [] BMXAA6370I - Total number of users connected to the system: 2
Are users connected higher when the system is slow. Are there enough UI cluster servers for the number of users.
Step 3 Review the Performance Best Practice Guide for your release. (Perform step 4 at the same time as they compliment each other)
These guides have been created by experts in performance tuning of Maximo systems and is based on experience of real life situations and installations.
They may appear a little daunting on first read as they do cover most areas of a system, not just Maximo, but the information inside is invaluable...ignore it at your peril (insert evil laugh here).
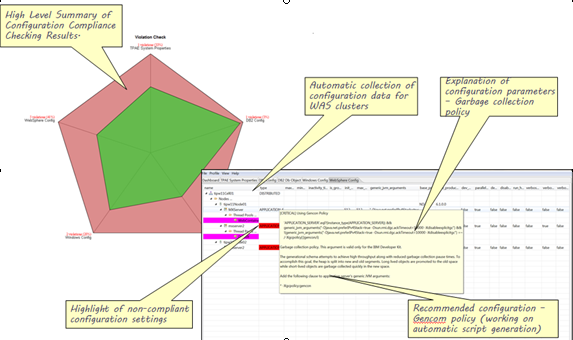
Step 4 Install and run the IBM Performance Analysis Suite
http://tlpa-pc.swg.usma.ibm.com/TivoliTools/tla/tlaupload_display.jsp?menutabid=3&name=&email=&team=
It needs SSH communications …. Windows may not have this, but there are many free products on the internet to provide SSH
It does NOT give a real time picture of what is happening. It investigates configuration settings and provides an easy to view output showing where best practices are not adhered to.
A good place to start with this step would be to watch this IEA (short video) to help you install/configure it.
Run the Maximo config plugin
Review the output graph and data – Green is good, red.....not so good. You can click on any area of the graph to get details of the settings that may need attention (and hover over the detail to get background info).
Steps 5 and 6 are more general advice, but often help.
Step 5 Make sure you are running up to date software.
WebSphere - newer fixpack levels have made significant performance improvements and resolved issues that can easily slow a system.
Maximo - Many leaks and other performance affecting issues are resolved at later fixpack levels and cumulative fix levels.
Maintenance is a good thing :-)
Step 6 Do you have multiple servers or running everything on one? Have you separated Reports / crontasks / Integrations to their own servers so they do not affect UI users ?
These can all be high resource consumers and are often at the heart of slowness for users.
The above will hopefully give you a good amount of information on what is running slowly, what is running out of memory, what is filling the memory.
Ensuring your software is not too out of date and following the Performance Best Practice Guides, will also hopefully resolve your issue, but if you need more help, just open a PMR with IBM.
When opening a PMR for Maximo performance, please check this link for information to gather
Have logs available (that cover the time when the system was actually slow) and which includes the logging above
Export the output from the IBM Performance Analysis Suite
If the system crashes, save and supply any dumps for review along with logs that show the time leading up to the crash.
As I said somewhere near the start, performance is a complex subject. I have only scratched the surface here, but hopefully it will give you a place to start.
[{"Business Unit":{"code":"BU059","label":"IBM Software w\/o TPS"},"Product":{"code":"SSLKT6","label":"IBM Maximo Asset Management"},"Component":"","Platform":[{"code":"PF025","label":"Platform Independent"}],"Version":"","Edition":"","Line of Business":{"code":"LOB59","label":"Sustainability Software"}}]
UID
ibm11133061