Technical Blog Post
Abstract
IBM Sterling Integrator B2B PMR Best Practices
Body
PMR Best Practices
Providing relevant and detailed information in your Problem Management Record (PMR) is essential in order for IBM Technical Support Analysts to quickly assist in resolving your issue.
Select the correct product
Is the problem you're having with Sterling Secure Proxy, Sterling Connect:Direct, Sterling B2B Integrator server or another Sterling product? Try and identify, to the best of your ability, the product that is experiencing the issue. Opening the PMR with the wrong product team will most likely result in a slower time-to-resolution. Look at messages and see if a product name or feature is mentioned for example:
[2011-05-16 13:29:29.14] ERROR 000000000000 GLOBAL_SCOPE [CDServerCopyToService] - setting WFC Status to ERROR with Advanced Status [Connect:Direct Server Error] com.sterlingcommerce.woodstock.cdinterop.server.CDInteropRemoteNodeException: ACOP017I
This error is coming from the Connect:Direct Server, so the PMR should be opened with the Sterling Connect:Direct team.
Problem Title
Similar to twitter, the title is your chance to pack as much key information as you can into the 54 characters allowed.
- Include the error code (such as ACOP0171 from the example above)
- Descriptions of the scenario New Partner, New Install, Patch applied, Network, Business Process
- Include keywords such as Database, Performance, Mapping, EDI, Protocol
Do not leave this field blank as it is the first thing an IBM Technical Support Analyst sees when trying to determine which sub-group should handle your PMR.
Problem Description
This is your chance to provide a back-drop of your issue. It's better to include too much, than not enough because this gives the analyst an opportunity to frame the issue in their mind and determine the next steps and data they'll want to review first. The description should explain the scenario well enough that the analyst could, if needed, attempt to recreate the problem in-house.
This section should answer the following questions:
- What is the issue that caused you to open this PMR?
- In which environment is this issue occurring: Production, Test, Quality Assurance, Development, etc.
- A description of your environment: is it clustered, how many clusters, how many nodes, is there an external perimeter server
- Is this happening for all protocols, all trading partners, all nodes, all clusters
- Has this ever worked (e.g. it's a "new" trading partner, setup ...)? Has this ever happened before,? When did it start happening and what may have changed?
- Can the issue be repeated? Does it occur only under certain conditions such as system load? When you restart the server after weekend maintenance? At server shut-down?
- What did you expect to occur and what actually occurred?
- List the steps you followed to cause the issue to occur and/or the steps IBM should follow to attempt to recreate your issue
- If you have a deadline by which you need this issue resolved include that in this section as well.
Diagnostic Data
If the PMR involves a problem instead of merely a question, then provide diagnostic data as soon as possible following the opening of the PMR. Look at the "Must Gather" technote http://www-01.ibm.com/support/docview.wss?uid=swg21661568 to determine if your issue falls into one of the areas listed and then supply the recommended "must gather" files.
Provide any additional relevant information along with the "must gather" data such as screen shots, business process data, instance data, properties files, etc.
For Sterling B2B Integrator PMRs always include the output of the dump_info script (dump_info.sh or dump_info.cmd).
Zip and/or compress the data and upload it to the PMR by following this technote: http://www-01.ibm.com/support/docview.wss?uid=swg21153852
Log Files
Log files are written underneath the install directory in a folder named "logs". For example if you installed SI into C:\IBM\SI then the logs are located in C:\IBM\SI\logs
Logs are enabled via the dashboard by selecting Operations -> System -> Logs.

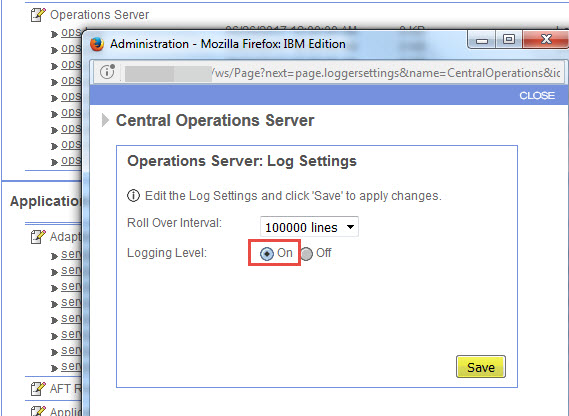
To enable a specific log, make sure you're on the desired node then locate the log name and determine the current logging level, the following shows that the ops.log is currently set to off.

To enable it click on the pencil and paper icon

Then turn the logging on
When you gather the logs, make sure to collect the logs from the correct day/time of the issue.
If you do not now where SI is installed, you can locate this by selecting Operations -> System Troubleshooter

Additional Resources:
- IBM Support Assistant
- Software Support Handbook
- IBM Software Accelerated Value Program
- IBM Support Portal - Sterling B2B Integrator
The postings on this site are my own and don't necessarily represent IBM's positions, strategies or opinions.
Click on "Host Information", then review the "Location:" setting.

UID
ibm11121073