This article is about sending the performance statistics from nimon (not njmon) to another popular Time-Series database called Prometheus. The Prometheus time-series data is getting extra attention in the last year because it is use in Red Hat OpenShift and Kubernetes.
The Prometheus Time-Series database is different to the other Time-Series tools in that the central Prometheus service polls the endpoints on your computer servers or virtual machines and then pulls the available data back to the database. The other Time-Series tools have endpoints gathering the performance statistics and when ready, they then push the data to the central database.
It might seem a small point but it requires Prometheus endpoints to run a sort of website, which is not trivial to implement in the C language, which is used to gather the performance stats. It is tricky on AIX, which has the excellent Perfstat Library in C. Prometheus endpoints tend to be written in Go and access to large C structures of data is complicated.
So nimon wants to push data and Prometheus wants to pull it. What we need is a tool in the middle of them that accepts push requests from nimon then hold the data until Prometheus polls and pulls the data. In this article, we use a tool from the company Influxdata (the InfluxDB team) and called Telegraf. This tool can handle dozens of input formats and dozens of output formats. It is a real "multi-function adapter" like the Switz Army knife for transforming data.
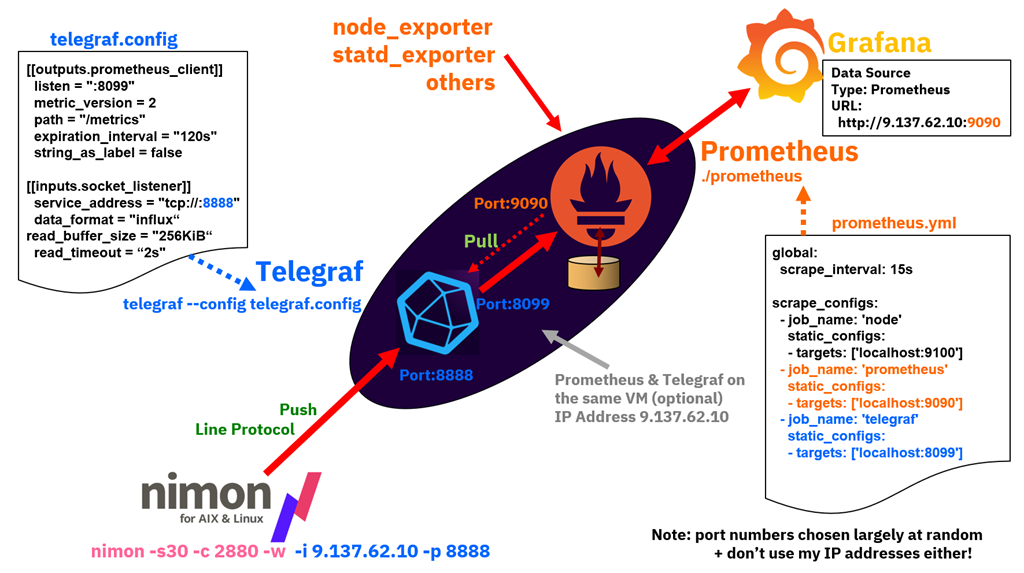
So here is my worked example of the nimon to Telegraf to Prometheus to Grafana data chain.
  global:
    scrape_interval:     15s

    scrape_configs:
      - job_name: 'node'
         static_configs:
         - targets: ['localhost:9100']
      - job_name: 'prometheus'
         static_configs:
         - targets: ['localhost:9090']
       - job_name: 'telegraf'
          static_configs:
          - targets: ['localhost:8099']
Comments:
- Ignore the job_name: 'node' stanza that was for testing the Prometheus with the node_exporter endpoint to collect stats to prove I had a working Prometheus service
- The job_name: 'prometheus' stanza sets the IP port number of 9090 for Grafana to connect to Prometheus as a data source later.
- The job_name: 'telegraf' stanza sets the IP port number of 8099 for Prometheus to pull the data from telegraf.
To run Prometheus:
./prometheus
By default it looks in the current directory for the prometheus.yml file.
This method is obviously a simple way to get Prometheus running and it outputs logging information on the screen. Read the Prometheus documentation on how to run it as a service and restarted every time the server or virtual machine is rebooted.
2) Telegraf - current at the time is version 1.14.3
  [[outputs.prometheus_client]]
    listen = ":8099"
    metric_version = 2
    path = "/metrics"
    expiration_interval = "120s"
    string_as_label = false

[[inputs.socket_listener]]
    service_address = "tcp://:8888"
    data_format = "influx"
    read_buffer_size = "256KiB"
    read_timeout = "2s"
Comments:
- The outputs.prometheus_client stanza tells Telegraf to prepare for a Prometheus server to connect and pull data from Telegraf on this port number 8099. The expiration_interval of 120 seconds is how long Telegraf buffers the last set of statistics. As we expect Prometheus to comment then much faster than that rate.
- The outputs.socket_listener stanza with port 8888 if of type influx so it opens this network socket and expect InfluxDB Line Protocol formatted statistics. As nimon sends the statistics in one short burst, the read_timeout of 2 seconds lets telegraf know not to expect any further stats. Note: use nimon with the -w command-line option to remove three lines it would send to InfluxDB concerning the InfluxDB and authentication. These lines are not needed with Telegraf. Telegraf ignores them but added needless warning to the log file.
To run Telegraf:
telegraf --config telegraf.config --debug
Note:
- The command-line option --debug can but be used in production but provides useful feedback that the statistics are arriving and being collected by Prometheus.
This method is obviously a simple way to get Telegraf running and it outputs logging information on the screen. Read the Telegraf documentation on how to run it as a service and restarted every time the server or virtual machine is rebooted.
3) nimon - current at the time is version 63
On each of your virtual machines run:
nimon -s15 -c5760 -w -i 9.137.62.10 -p 8888
The IP address of 9.137.62.10 is the Telegraf server - you can use its hostname.
The nimon statistics are now pouring into Prometheus and my job is done - phew!
But we have to check that we can find data and graph the statistics. First, with Prometheus tools and then with Grafana.
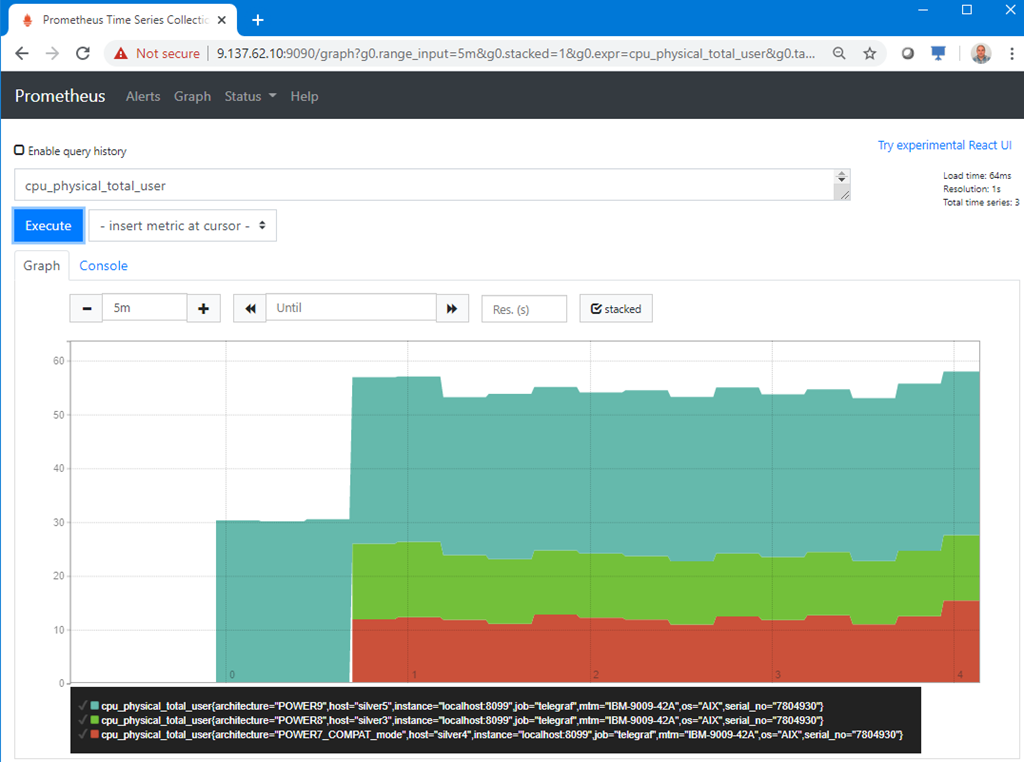
4) Graph data on the Prometheus graphical user interface
I am no expert with this tool but after some experiments I get the following in a browser connecting to port 9090. To find the nimon data, start typing in the box near the "Execute" button and it brings up statistic names that match in the database. I tried the Prometheus endpoint data collector called node_exporter, so there was node_exporter statistic names and nimon statistic names. Initially, the two data sources were a little confusing. So I deliberately, searched to nimon statistics names like "cpu_physical_total_user".
Here are three virtual machines on my POWER9 server with three difference AIX releases.
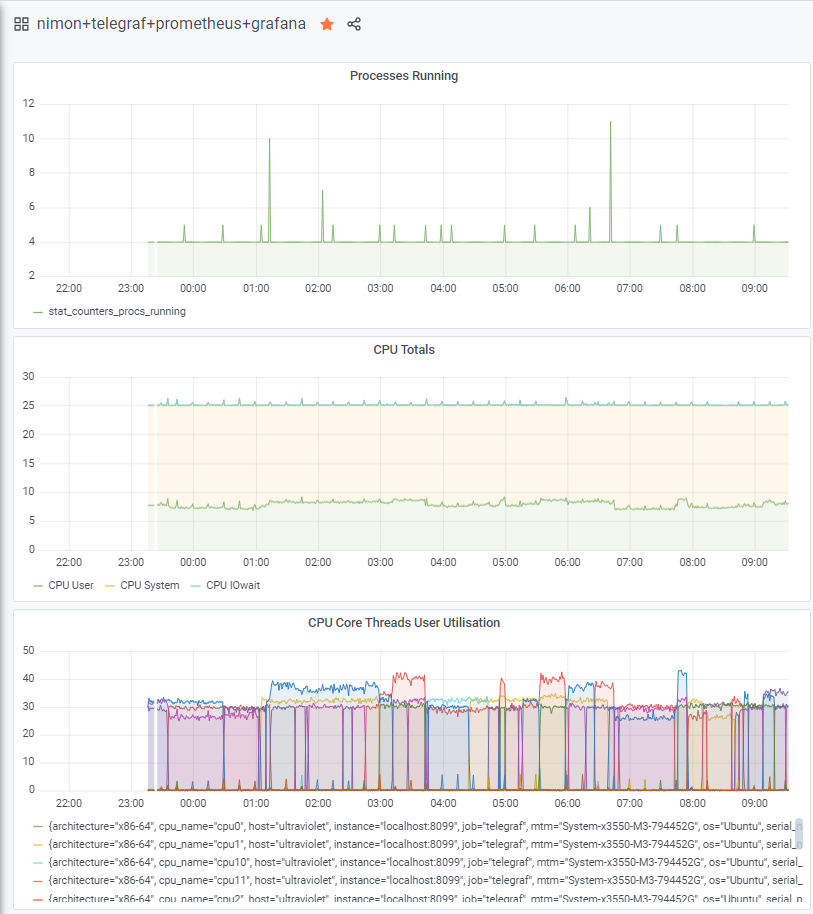
5) Grafana - current at the time is version 7.0.1
I have use Grafana with InfluxDB data for a few years but it was a little shocking that there are differences with using the Prometheus as the data source. It takes time to workout the differences.
I added the new Prometheus data source to Grafana, used the Prometheus IP address and port number 9100. It was straight forward and the same process as connecting Grafana to InfluxDB. Then, I created three graphs but it is handled differently with Prometheus data than with InfluxDB. The problem is caused by the two data schema being different.
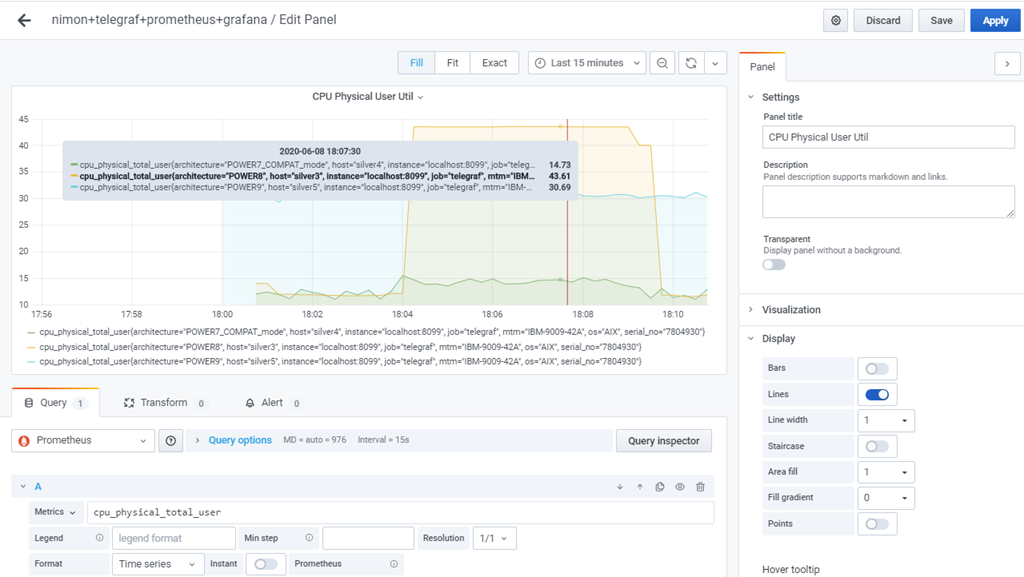
Here are the settings behind a simple graph:
This article gets you off to a flying start and I am happy that my njmon and nimon tools can feed Prometheus and keep Prometheus enthusiasts happy too.
One key feature of nimon is that for AIX on a virtual machine with four disks, 1 network, 2 CPUs with SMT=8 there are 1575 performance statistics available.
The numbers of statistics grows rapidly, if:
- There are many resources like CPUs, filesystems and disks.
- You included processes monitoring.
- - - The End - - -