How To
Summary
A few simple but powerful shell scripts to extract the key sizing facts from large numbers of performance statistics files for many servers over a long period.
Objective

If you have thousands of nmon files, you can drown in the high volumes of data. You need to extract the key facts to allow planning your server consolidation, Migrating to newer servers or POWER Live Partition Mobility. These nsum shell scripts allow does the hard work to build a CSV file to import into a spreadsheet for further work.
Environment
AIX server to run the Korn shell scripts
Steps
Update for nsum Version 5 - Oct 2022
- Added a Dedicated processor LPAR feature to match the Shared processor LPARs stats. The data uses comes from the nmon CPU_ALL lines and the CPU Busy% (User_time% + System_time%) and the number of CPUs to determine the numbers of CPU cores being consumed. The stats are min average, max, and 95th percentile for CPU cores in use and the number of cores assigned to the LPAR. The report includes "Dedicated CPU using CPU_ALL" to highlight how the statistics are calculated.
nmonfile, snapshots, VP, E, VP:E, poolCPU, poolIdle, Weight, Capped, total, min, avg, max, 95percentileCPU, RunQueue95 nmon-filename, 282, 24, Dedicated, CPU, using, CPU_ALL, , , 3799.10, 1.42, 3.23, 14.86, 9.12, 5 282 = number of snapshots 24 = number of CPU cores in the LPAR (like VP) ... 1.42 = minimum CPU cores 3.23 = average CPUS cores 14.86 maximum CPU cores 9.12 = 95th percentile CPU cores being consumes 5 = Run queue - Note: Previously nsum only supported Shared processor LPARs, where all the information is from the nmon LPAR lines and includes many other stats.
Update for nsum Version 4 - Sept 2022
- Added Run Queue 9th percentile to CPU report - good for checking SMT=8 use
- Added disk sizes and I/O rates
- Added network I/O rates - useful for adapter selection
- Added Fibre Channel I/O rates - useful for adapter selection
- Added JFS config - to determine file system sizes and uses.
The details are reported for each nmon file in a list and not summarized.
The JFS feature is experimental as total file system use is not generally helpful unless the servers are running GPFS Spectrum Scale. - Changed nsum_run to include the output report name and input is all the nmon files in the current directory.
Note: The scripts can run on Linux but not checked recently. Some statistics are only available in the nmon for AIX files.
A couple of times a month I get a question like this:
- I was sent 35 gigabytes of nmon files covering the last month, about 6 servers with 40 LPARs (virtual machines) each server in total ~6000 files.
- How do I load that in to the nmon Analyser to see the graphs?
My first reaction is: If you have too many statistics, then it is not my problem. I developed nmon for AIX and nmon for Linux and not the nmon analyser. If you stop and think, it is obvious that you are never ever going to load 35 GB in to Excel on a laptop with 8 to 16 GB of memory. Excel is likely to grind the laptop to a halt or crash with 100 MB of data.
First lesson:
Don't try to do a capacity planning exercise that uses performance monitoring and tuning data.
- Even one LPAR the 30 nmon files can crash Excel. You don't have a nmon problem or an Excel problem but you do have a too much data problem. Don't even dream of merging nmon files for a week or month. You are facing a major data management issue due to too much data.
Note:
It is best to not comment on the people taking 1000's of nmon data snapshots a day or running nmon for days at a time - they can crash Excel with a single file.
They deserve what that asked for!
Excel is limited to about 255 columns.
It is best to not comment on the people taking 1000's of nmon data snapshots a day or running nmon for days at a time - they can crash Excel with a single file.
They deserve what that asked for!
Excel is limited to about 255 columns.
A second common mistake is wanting to display more than 10,000 data points on a graph being displayed on a screen with 1920 pixels across!
Second Lesson: Change to nmonchart.
This ksh script graphs the nmon files much faster than Excel (typically a second or two) and can tackle much larger files. As it is a script, you can run it on 100's of files in a directory on AIX or Linux. If it is on a POWER Server, then run many of them in parallel. So depending on the size of the nmon files, it can process a few thousand files an hour (single stream shell script looping thought files). The viewing is by your browser - one nmon graphs set per browser tab.
Third Lesson: Building a data repository for capacity planning is nontrivial
There are various tools that take nmon data and then graph LPAR statistics:
There are various tools that take nmon data and then graph LPAR statistics:
- Like free to use nmon2rrd, nmon2web that use rrdtool to store the data and then generates rrdtool graphs.
- There a nonfree 3rd party tools like MPG and many others that take nmon files as input to their performance monitoring and capacity planning tools.
- There is also IBM's own comprehensive IBM Tivoli Monitoring tools.
For long-term performance and capacity planning, tools like these are a good idea. If it is a once only exercise, then you are not going to want to find the hardware and spend a couple of weeks to months setting up the tools. There are alternative like LPAR2RRD and Ganglia too that does not use nmon files.
Fourth Lesson: Newer tools avoid all this data management
We also have new wave performance tools with a new data collector njmon, which outputs JSON format and a lot more stats than nmon. The data can then live sent into time aware databases and then live dynamic graphing tools like InfluxDB + Grafana, ELK, Splunk. For more information: http://nmon.sourceforge.net/pmwiki.php?n=Site.Njmon. You can also inject nmon files by using nmon2json formatter (http://nmon.sourceforge.net/pmwiki.php?n=Site.Nmon2json)
We also have new wave performance tools with a new data collector njmon, which outputs JSON format and a lot more stats than nmon. The data can then live sent into time aware databases and then live dynamic graphing tools like InfluxDB + Grafana, ELK, Splunk. For more information: http://nmon.sourceforge.net/pmwiki.php?n=Site.Njmon. You can also inject nmon files by using nmon2json formatter (http://nmon.sourceforge.net/pmwiki.php?n=Site.Nmon2json)
Assuming it is a once only project
So lets assume you are doing a "once only" audit or capacity planning or server consolidation exercise. Not time to get organized and tooled up. What you need to do is extract a summary from the 100's of nmon files. Then, have those summaries in CSV format so you can load the resulting data in to an excel spread sheet. I am going to assume you are a real technical person, so no Windows tools here! You have access to AIX or Linux and are OK with simple shell scripts that use grep and awk.
So lets assume you are doing a "once only" audit or capacity planning or server consolidation exercise. Not time to get organized and tooled up. What you need to do is extract a summary from the 100's of nmon files. Then, have those summaries in CSV format so you can load the resulting data in to an excel spread sheet. I am going to assume you are a real technical person, so no Windows tools here! You have access to AIX or Linux and are OK with simple shell scripts that use grep and awk.
Let us get organized.
If you have nmon files from different servers, then place them in different directories. The nmon file names are carefully designed: <hostname>_<date>_<time>.nmon
If you have nmon files from different servers, then place them in different directories. The nmon file names are carefully designed: <hostname>_<date>_<time>.nmon
- The result is that the files sort nicely with the ls -l command for hostname and then time.
- Note: Some systems administrators deciding their own rubbish file names in a shell script, which is often buggy and then blame nmon!
- You can then pick out a set of nmon files for a particular day like today's (23 November 2018) ls -1 *_20181123_*.nmon
So here are a few simple scripts to extract General information, CPU stats, Memory, disks, Networks FC, and JFS usage.
- In our example, we need to quiz the IT staff to decide on a busy day to focus on. Latter we might explore other days for comparison.
- So we have 6 directories for the 6 servers and roughly 40 LPARs for 30-ish days.
- We want a summary of the LPARs for a specific day.
- Instead of time-based graphs like nmon we need to step back and get basic config then minimum, average, maximum and 95% type stats on the CPU and Memory.
- With 240 LPARs in our example, we need to cut down on the stats per LPAR to a basic few.
95th percentile calculations are simple in ksh:
- Put all the values in a file one value per line
- Once the file is complete sort the file numerically (sort -nr)
- Ignore the lines containing the largest five percent of the numbers
- That largest number left is the 95th percentile.
integer RECORDS
integer PERCENTILE

RECORDS=$(cat tmpfile | wc -l)

PERCENTILE=$RECORDS-$RECORDS/20

cat tmpfile | sort -nr | tail -$PERCENTILE | read result

echo 95th percentile is $result
Here are the statistics I recommend
Basic configuration:
- nmon file
- nmon version
- AIX version
- Time
- Date
- Interval - between snapshots
- Snapshots
- CPUs-Max-Current
- Serial number
- LPAR-Number-Name,
- Machine Type Model
- Hardware-description
CPU statistics:
- nmon file
- Snapshots = the number of times the data was collected. If the snapshot number is unexpectedly low, it suggests nmon did not finish, or the file is corrupted.
- VP - Virtual Processors
- E - Entitlement
- VP:E Virtual Processor to Entitlement ratio
- Pool CPU: Number of CPUs in the shared CPU pool. A zero indicates that the user did not set the correct options on the HMC
- Pool Idle: Number of CPUs that are Idle (unused) in the shared CPU.
- Weight = how important the LPAR is and allows it to grab more of the unused CPU time from the pool.
- Capped = not allowed to go over the Entitlement at any time.
- Minimum - CPU core use
- Average - CPU core use
- Maximum - CPU core use
- CPU core use 95th Percentile
- 95% percentile = CPU used, Put all the values in a list highest first then remove the top 5% and the highest value now at the top it this number. A great way to ignore sudden peaks in volatile stats.
Memory statistics:
- nmon file
- Count
- Total Used
- Minimum Used
- Average Used
- Maximum Used
- 95th Percentile in MB
Disk Statistics from FILE and PROC statistics:
- nmon file
- hdisks - the number of disks
- totalGB - the um total GB
- Syscallreads95 - Read system call 95th Percentile, includes file, pipe, sockets
- Syscallwrites95 - Writes system call 95th Percentile, includes file, pipe, sockets
- FILEread95 - Process Read, 95th Percentile
- FILEwrite95 - Process Write, 95th Percentile
Network Statistics from NET statistics:
- nmon file
- Networks - number of network interfaces
- readKB95- Read KB/sec 95th Percentile
- writeKB95 Write KB/sec 95th Percentile
Fibre Channel Storage Area Network adapter ports:
- nmon file
- FC-adapter-ports - number of adapter ports
- readKB95 - Read KB/sec 95th Percentile
- writeKB95 - Write KB/sec 95th Percentile
- xfer95 - Transfer per sec 95th Percentile
The sample files were selected at random. I hope your nmon files are MUCH more consistent.
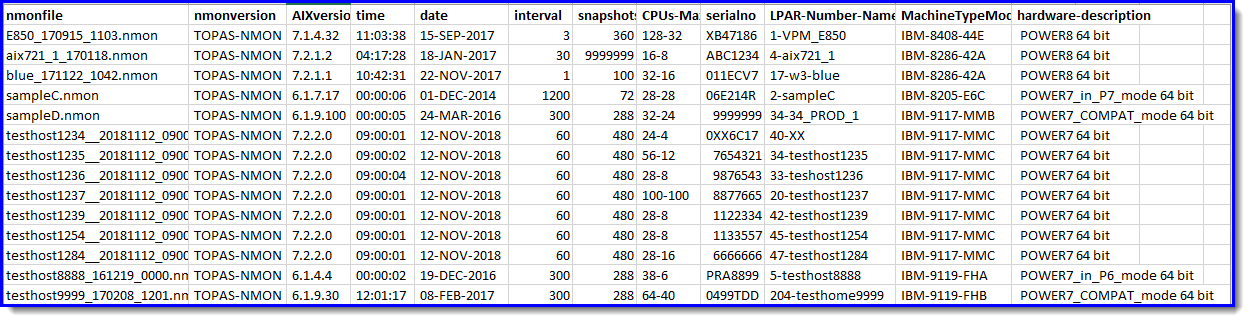
Sample nsum_gen output:
  $ nsum_gen
nmonfile, nmonversion, AIXversion, time, date, interval, snapshots, CPUs-Max-Current, serialno, LPAR-Number-Name, MachineTypeModel, hardware-description
E850_170915_1103.nmon , TOPAS-NMON, 7.1.4.32, 11:03:38, 15-SEP-2017, 3, 360, 128-32, XB47186, 1-VPM_E850, IBM-8408-44E,  POWER8 64 bit
aix721_1_170118.nmon , TOPAS-NMON, 7.2.1.2, 04:17:28, 18-JAN-2017, 30, 9999999, 16-8, ABC1234, 4-aix721_1, IBM-8286-42A,  POWER8 64 bit
blue_171122_1042.nmon , TOPAS-NMON, 7.2.1.1, 10:42:31, 22-NOV-2017, 1, 100, 32-16, 011ECV7, 17-w3-blue, IBM-8286-42A,  POWER8 64 bit
sampleC.nmon , TOPAS-NMON, 6.1.7.17, 00:00:06, 01-DEC-2014, 1200, 72, 28-28, 06E214R, 2-sampleC, IBM-8205-E6C,  POWER7_in_P7_mode 64 bit
sampleD.nmon , TOPAS-NMON, 6.1.9.100, 00:00:05, 24-MAR-2016, 300, 288, 32-24, 9999999, 34-34_PROD_1, IBM-9117-MMB,  POWER7_COMPAT_mode 64 bit
testhost1234__20181112_0900.nmon , TOPAS-NMON, 7.2.2.0, 09:00:01, 12-NOV-2018, 60, 480, 24-4, 0XX6C17, 40-XX, IBM-9117-MMC,  POWER7 64 bit
testhost1235__20181112_0900.nmon , TOPAS-NMON, 7.2.2.0, 09:00:02, 12-NOV-2018, 60, 480, 56-12, 7654321, 34-testhost1235, IBM-9117-MMC,  POWER7 64 bit
testhost1236__20181112_0900.nmon , TOPAS-NMON, 7.2.2.0, 09:00:04, 12-NOV-2018, 60, 480, 28-8, 9876543, 33-t
  $ nsum_cpu
nmonfile, snapshots, VP, E, VP:E poolCPU, poolIdle, Weight, Capped, total, min, avg, max, 95percentile
E850_170915_1103.nmon,      360,   8,  8.00, 100.00%,   0,  0.00,   128, 0,   416.61,  0.01,  1.16,  3.29,  2.41
aix721_1_170118.nmon,      417,   1,  0.20, 500.00%,   0,  0.00, 128, 1,    11.65,  0.03,  0.03,  0.06,  0.04
blue_171122_1042.nmon,      100,   4,  3.00, 133.33%,   0, 13.82, 200, 0,   197.08,  0.01,  1.97,  3.74,  3.32
sampleC.nmon,       30,   9,  7.00, 128.57%,   0,  1.00,  51, 1,    93.80,  1.31,  3.13,  6.38,  5.96
sampleD.nmon,      288,   6,  3.50, 171.43%,  26, 10.89, 128, 0,   647.43,  0.20,  2.25,  5.70,  5.06
testhost1234__20181112_0900.nmon,      480,   1,  0.10, 1000.00%,   0,  0.00, 192, 01,     8.75,  0.01,  0.02,  0.08,  0.03
testhost1235__20181112_0900.nmon,      480,   3,  0.50, 600.00%,   0,  0.00, 192, 0,    66.14,  0.04,  0.14,  0.69,  0.44
testhost1236__20181112_0900.nmon,      480,   2,  0.30, 666.67%,   0,  0.00, 128, 0,    48.31,  0.03,  0.10,  0.47,  0.34
  $ nsum_mem
nmonfile, count, total_used, min_used, avg_used, max_used, 95percentileMB
E850_170915_1103.nmon,      360, 5837558.20, 12661.50, 16215.44, 18561.70,  18531.40
aix721_1_170118.nmon,      417, 678009.00, 1619.10, 1625.92, 1634.10,  1633.40
blue_171122_1042.nmon,      100, 1603607.00, 16035.60, 16036.07, 16036.70,  16036.70
sampleC.nmon,       31, 1630130.20, 52549.30, 52584.85, 52681.40,  52680.00
sampleD.nmon,      288, 13116070.20, 36336.70, 45541.91, 48097.00,  48093.90
testhost1234__20181112_0900.nmon,      480, 966217.10, 2008.80, 2012.95, 2016.70,  2016.20
testhost1235__20181112_0900.nmon,      480, 10405805.60, 21624.10, 21678.76, 21834.70,  21711.50
testhost1236__20181112_0900.nmon,      480, 6958848.70, 14456.30, 14497.60, 14534.80,  14516.50
$ nsum_disk *.nmon*
nmonfile, hdisks, totalGB, Syscallreads95, Syscallwrites95, FILEread95, FILEwrite95
E850_170915_1103, 4,2248, 926,12236, 6556949,205552
aix721_1_170118, 6,34, 131,59, 234065,6369
blue_171122_1042, 4,512, 59,21, 68335,2464
sampleC, 17,5445, 5981,6169, 25207911,33139238
sampleD, 12,1254, 19621,4701, 157068032,37516314
test_Linux, 0,0, -1,-1, ,
testhost1234__20181112_0900, 2,144, 78,1202, 199553,93530
testhost1235__20181112_0900, 10,1514, 2196,2631, 2368534,2069865
testhost1236__20181112_0900, 10,1288, 1865,2191, 1548320,1837759
$ nsum_net  *.nmon*
nmonfile, Networks, readKB95, writeKB95
E850_170915_1103, 2, 2936.0,2936.0
aix721_1_170118, 2, 4.0,5.0
blue_171122_1042, 2, 12.0,3.0
sampleC, 4, 700.0,9580.0
sampleD, 3, 6949.0,9148.0
test_Linux, 6, 188560.0,105677.0
testhost1234__20181112_0900, 3, 106.0,87.0
testhost1235__20181112_0900, 3, 766.0,833.0
testhost1236__20181112_0900, 3, 509.0,550.0
$ nsum_fc  *.nmon*
nmonfile, FC-adapter-ports, readKB95, writeKB95 xfer95
E850_170915_1103, 3, 5284.0,329.0, 471.0
aix721_1_170118, 1, 37.0,31.0, 7.0
blue_171122_1042, 2, 0.0,0.0, 0.0
sampleC, 4, 186365.0,97734.0, 60725.0
sampleD, 4, 52603.0,15799.0, 1924.0
test_Linux, 0, 0.0,0.0, 0.0
testhost1234__20181112_0900, 4, 70.0,64.0, 4.0
testhost1235__20181112_0900, 4, 1781.0,2691.0, 1076.0
testhost1236__20181112_0900, 4, 755.0,2520.0, 705.0
$ nsum_jfs  sampleD.nmon blue*
sampleD:,
        , "Filesystem",MBblocks,Free,%Used,Iused,%Iused,"MountedOn"
        , "/dev/hd4",1024.00,469.09,55,15511,11,"/"
        , "/dev/hd2",6144.00,938.97,85,96669,26,"/usr"
        , "/dev/hd9var",5120.00,1110.89,79,19617,4,"/var"
        , "/dev/hd3",5120.00,1750.33,66,51145,11,"/tmp"
        , "/dev/hd1",2048.00,1375.63,33,12614,4,"/home"
        , "/dev/hd10opt",4096.00,2013.14,51,29911,6,"/opt"
        , "/dev/livedump",256.00,255.64,1,4,1,"/var/adm/ras/livedump"
        , "/dev/database1_log01",13312.00,5257.65,61,8,1,"/database1/log/log01"
        , "/dev/database1_log02",9216.00,5178.28,44,6,1,"/database1/log/log02"
        , "/dev/database1_dat01",233472.00,17424.10,93,30,1,"/database1/data/data01"
        , "/dev/database1_dat02",64512.00,6249.86,91,11,1,"/database1/data/data02"

blue_171122_1042:,
        , "Filesystem",MBblocks,Free,%Used,Iused,%Iused,"MountedOn"
        , "/dev/hd4",17664.00,3329.79,82,20046,3,"/"
        , "/dev/hd2",6400.00,4034.30,37,53164,6,"/usr"
        , "/dev/hd9var",2304.00,390.01,84,13817,12,"/var"
        , "/dev/hd3",4096.00,4045.44,2,128,1,"/tmp"
        , "/dev/hd1",32768.00,6238.11,81,36310,3,"/home"
        , "/dev/hd10opt",4096.00,3596.93,13,8853,2,"/opt"
        , "/dev/fslv01",98304.00,78384.52,21,10205,1,"/webpages"
  #!/usr/bin/ksh
# nsum version 4 Sept 2022 Nigel Griffiths

OUT=nsum_report.csv
echo Output to $OUT

# For regular nmon files the program all the nmon files in the current directory
# For topas output files in nmon format change *.nmon to  *.topas.csv
# Note: Linux - not all data is available. Good luck.
# Note: AIX JFS statistics are collected at the end of the capture. If nmon was stopped early, it will not be be there.

echo nsum v4 file $OUT >$OUT

echo General Info >>$OUT
nsum_gen *.nmon   >>$OUT
echo General done

echo              >>$OUT
echo CPU          >>$OUT
nsum_cpu *.nmon   >>$OUT
echo CPU done

echo              >>$OUT
echo Memory       >>$OUT
nsum_ram *.nmon   >>$OUT
echo RAM done

echo              >>$OUT
echo Disks         >>$OUT
nsum_disk *.nmon  >>$OUT
echo Disks done

echo              >>$OUT
echo Networks      >>$OUT
nsum_net *.nmon   >>$OUT
echo Networks done

echo              >>$OUT
echo FC Adapter Ports        >>$OUT
nsum_fc *.nmon >>$OUT
echo FC SAN Adapter Ports done

echo              >>$OUT
echo JFS          >>$OUT
nsum_jfs *.nmon   >>$OUT
echo JFS done

echo All Done
In the download file, there are samples of the reports in various formats:
- nsum_report.csv
- nsum_report.xlsx
- nsum_report_with_total_calculations.xlsx
Some comments on the report once in a spreadsheet
General information
CPU Statistics:
Added Column Totals to some columns of data and colored them RED
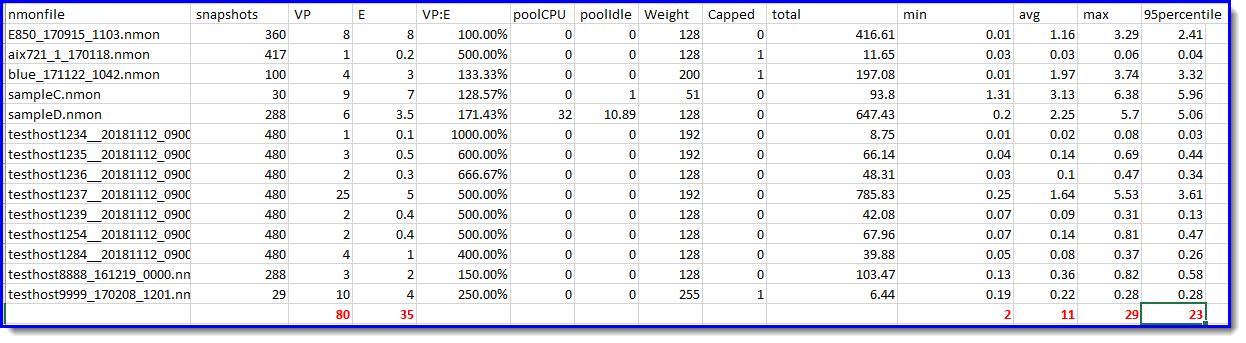
Notes:
- As an example, if the statistics are from a POWER7 processor-based server. The 95% percentile total is 23 CPUs. From the IBM POWER7 Performance Report for this server model to find and calculate the rPerf number for the original server. From that a suitable target Power10 processor-based server can be determined.
- We can also run some sanity checks: If the E = Entitlement is more that 1, then the VP:E ratio is recommended to be no more that 200% (150% is better). If it is, the LPAR is too widely spread across CPUs, and the result is inefficient use of the CPUs and slower execution.
- Only one LPAR has the Pools stats switched on and it reports there are 10.89 unused CPUs - that is a tuning opportunity.
- We can see that the max CPU is 29 but the 95% is a smaller number. The LPARs might not peak at the same time.
Memory information

Notes:
- I formatted the cells to remove the fractions of MBs - we have enough digits already
- The total memory needed is 298087 MBs = 3TBs.
- Don't forget AIX soaks up available memory in to the file system cache to reduce disk I/O - we might not need all of the memory.
Well, I hope this article allows quick analysis of vast numbers of nmon file.
Download the scripts and samples:
- Supports Dedicated CPU LPAR by using the nmon CPU_ALL statistics.
- Available on https://github.com/nigelargriffiths/nsum
- All future versions will be found at the GitHub website.
- The nmon files must include the "LPAR" lines, which are only generated for Shared CPU partitions (that is not dedicated CPU partitions).
- All scripts are roughly 40 lines of ksh.
- All straight forward if you know your grep and awk commands.
- If you hit a bug, send me the nmon file to investigate the issue.
Note: run the rperf script on AIX to determine the rPerf rating of the LPAR.
Additional Information
Other places to find content from Nigel Griffiths IBM (retired)
- YouTube - YouTube Channel for Nigel Griffiths
- AIXpert Blog
Document Location
Worldwide
[{"Business Unit":{"code":"BU058","label":"IBM Infrastructure w\/TPS"},"Product":{"code":"SWG10","label":"AIX"},"Component":"","Platform":[{"code":"PF002","label":"AIX"}],"Version":"All Versions","Edition":"","Line of Business":{"code":"LOB08","label":"Cognitive Systems"}},{"Business Unit":{"code":"BU054","label":"Systems w\/TPS"},"Product":{"code":"HW1W1","label":"Power -\u003EPowerLinux"},"Component":"","Platform":[{"code":"PF016","label":"Linux"}],"Version":"All Versions","Edition":"","Line of Business":{"code":"","label":""}}]
Was this topic helpful?
Document Information
Modified date:
19 December 2023
UID
ibm11114107