Technical Blog Post
Abstract
Debugging JazzSM DASH client side issues with Chrome Developer Tools - Part 1
Body
Sometimes we face portal issues when it's easier and faster getting to the root cause by debugging from the client-side: the browser itself. For this task, the 'Developer Tools' kit included as part of Google's Chrome browser, and its V8 JavaScript engine, contains powerful capabilities to examine, with detail and at runtime, JS code execution as it happens.
A well known among DASH Support Engineers, the spinning wheel that appears when loading certain pages:

and commonly encountered after environment migrations and/or upgrades. During these, it is common for WebSphere *.xml application deployment descriptors to become corrupted, develop invalid references and sometimes just missing *.js files, which is the case we are going to examine:
We hit the spinning wheel when opening 'Data Sources' from the 'Administration' menu:
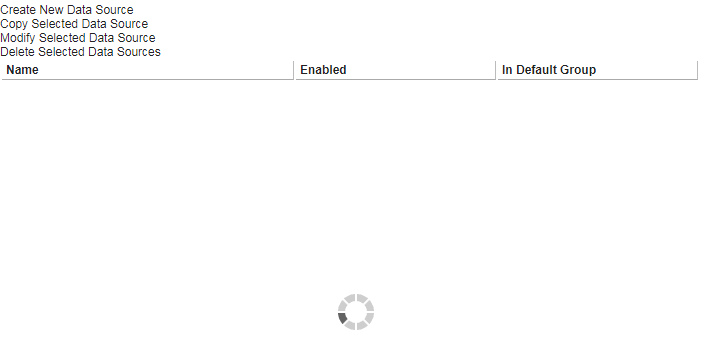
at this point, we can launch Chrome Developer tools from the menus or with 'Ctrl + Shift + J' or 'F12' on Windows or 'Cmd + Opt + J' on Mac, which will split the screen and bring the 'Console' into focus. Type of messages can be grouped by opening the 'Console Settings' menu; in this case can see an HTTP '404' error generated by 'dojo.js':

These client-side errors are in turn being logged by the Webcontainer filter on the server-side in '$JAZZHOME/profile/logs/server1/SystemOut.log':
[10/12/18 16:17:33:214 GMT] 00001802 filter E com.ibm.ws.webcontainer.filter.FilterInstanceWrapper doFilter SRVE8109W: Uncaught exception thrown by filter Session Prep Filter: java.io.FileNotFoundException: SRVE0190E: File not found: /scripts/dt/gridx/core/Core.js
at com.ibm.ws.webcontainer.extension.DefaultExtensionProcessor._processEDR(DefaultExtensionProcessor.java:967)
at com.ibm.ws.webcontainer.extension.DefaultExtensionProcessor.processEDR(DefaultExtensionProcessor.java:948)
the path to the file, as reported by the Developer Tools console error:
GET https://9.175.193.242:16311/ibm/console/webtop/scripts/dt/gridx/core/Core.js 404 (Not Found)
since the misisng page is a 'Webtop' object, ot translates in server filesystem terms to:
$JAZZSM_HOME/installedApps/JazzSMNode01Cell/isc.ear/OMNIbusWebGUI.war/scripts/dt/gridx/core/
we can copy this file over from another working system or from backup.
UID
ibm11082499