Technical Blog Post
Abstract
How to Identify Class Loader Synchronization Performance Bottlenecks in AIX, Linux and Windows
Body
Class loader synchronization bottlenecks are common problems brought to the attention of WebSphere Application Server L2 Support by our clients. This is a common type of performance problem called a livelock where many threads are contending on a set of locks. The performance overhead is proportional to the lock contention, so the problem might not show up in a test environment with a low number of concurrent requests, or patterns of requests which aren't exercising the lock at the same time. From the viewpoint of the application end user, this is seen as an application that is moving slowly. From the viewpoint of the WebSphere Administrator viewing the WebSphere Application Server SystemOut.log, this is typically seen as a series of hung (WSVR0605W) thread messages which "complete" (WSVR0606W) on their own....eventually.
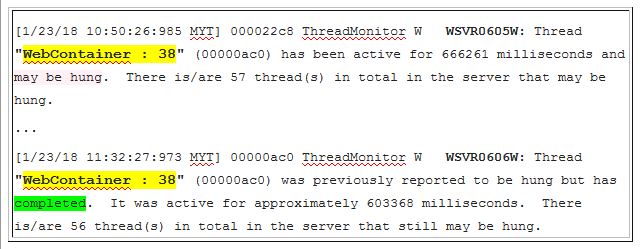
To diagnose, manually capture a javacore DURING the time while the thread is still hung, (or automatically capture javacore by configuring the hang detection policy - com.ibm.websphere.threadmonitor.dump.java) and search for the name of the reported hung (WSVR0605W) thread:
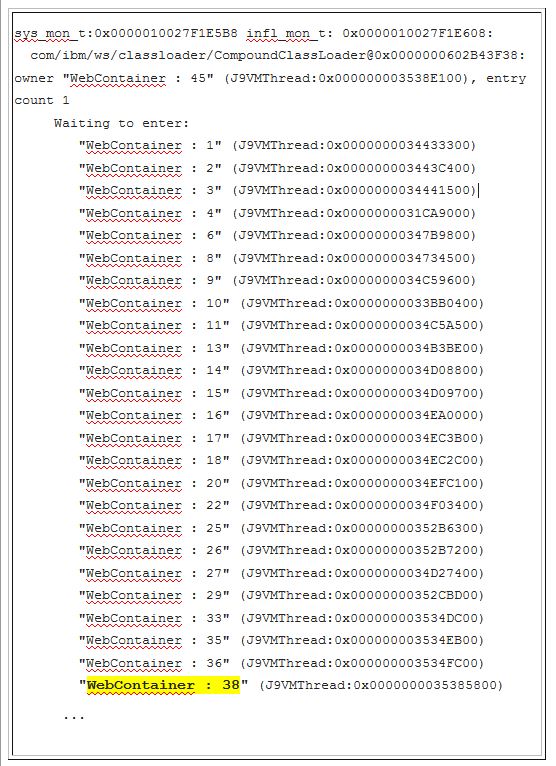
As you can see, the thread which has been reported "hung" is waiting in line with multiple other threads which are all waiting on the "owner" thread to complete. Once the owner thread completes, it will release the lock on "com/ibm/ws/classloader/CompoundClassLoader" and the next thread in line will become the owner of the lock and will be allowed to "complete". Because class loading is synchronized, only one thread may own the lock at a time. This results in a class loader bottleneck:
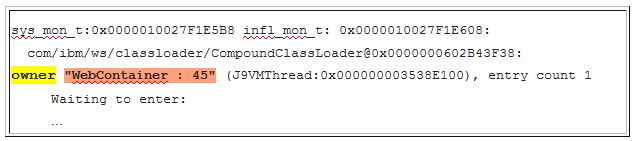
To identify the offending code, the next step is to investigate the stack of the "owner" thread (the one holding the lock while the rest of the threads wait), to identify where the bottleneck originates. Search further down in the javacore to locate the stack of the owner thread. Generally, walk down from the top of the stack, skipping any java/* and com/ibm/ws/* method frames until you reach the application or third party library code that's driving the livelock :
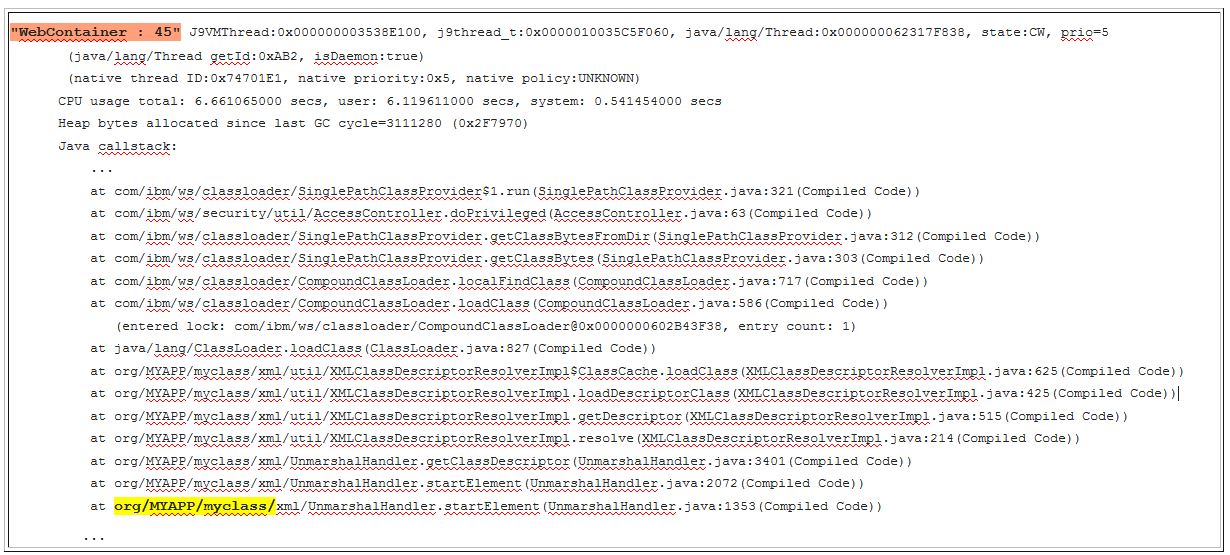
In the case of the example above, the development team using the "org/MYAPP/myclass" code will need to implement coding best practices to avoid class loader bottlenecks in this code:
Threading lightly, Part 2: Reducing contention
Related Topics:
Threading lightly, Part 1: Synchronization is not the enemy
IBM MustGather: Classloader problems for WebSphere Application Server
IBM JAXBContext Initialization Takes A Long Time
IBM XSLT transformations cause high CPU and slow performance
IBM MustGather: XML parser or XSL transformer problems in WebSphere Application Server
IBM WebSphere Application Server Performance Cookbook - Troubleshooting IBM Java
UID
ibm11081275