Technical Blog Post
Abstract
You would like to know how to use IBM Fault Analyzer product to format CICS Transaction Server for z/OS (CICS TS) auxiliary (AUX) trace datasets interactively! This can be much faster than formatting the trace datasets by submitting batch jobs to run the CICS trace formatting utility DFHTUxxx.
Body
When formatting trace using using batch jobs, you might have to run many jobs. In the first job, you might format the the abbreviated trace so you can see the time range the trace dataset covers, and perhaps get some task numbers. Then in a second job, you might limit the time range or task numbers formatted to ones you are interested in. Then in a third job, you might format only selected trace entries.
As an alternative, you can follow these steps to use IBM Fault Analyzer to format CICS AUX trace datasets interactively:
To get started, select option '9' from the File drop down on the Fault Analyzer main menu:

After pressing the Enter key, you are presented with a screen to enter the name of the AUX trace dataset:

Press the Enter key again. Once Fault Analyzer initializes the dataset, it will show you the familiar Trace Selection screen. The same one you would see if you want to view internal trace in a dump:

When you press the Enter key again, Fault Analyzer shows you the contents of the trace:
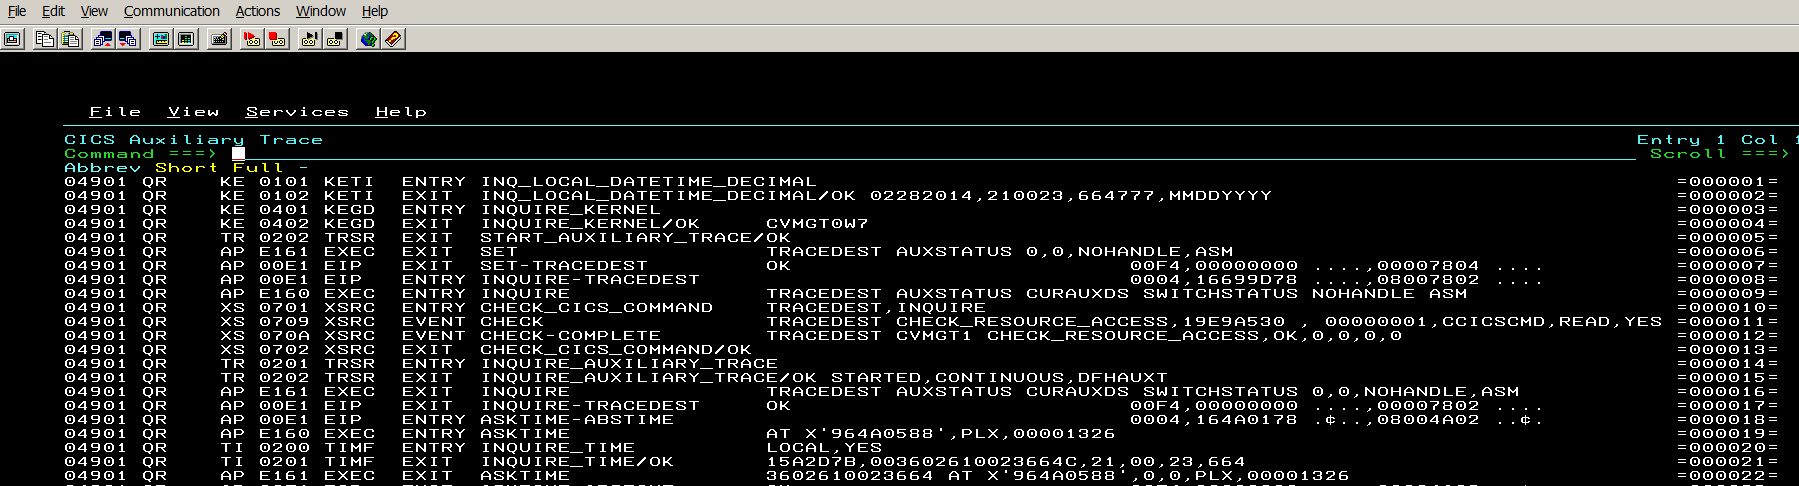
From here, you can toggle through the Abbreviated, Short or Full view simply by selecting the corresponding option at the top under the command line. No need to rerun another batch job!
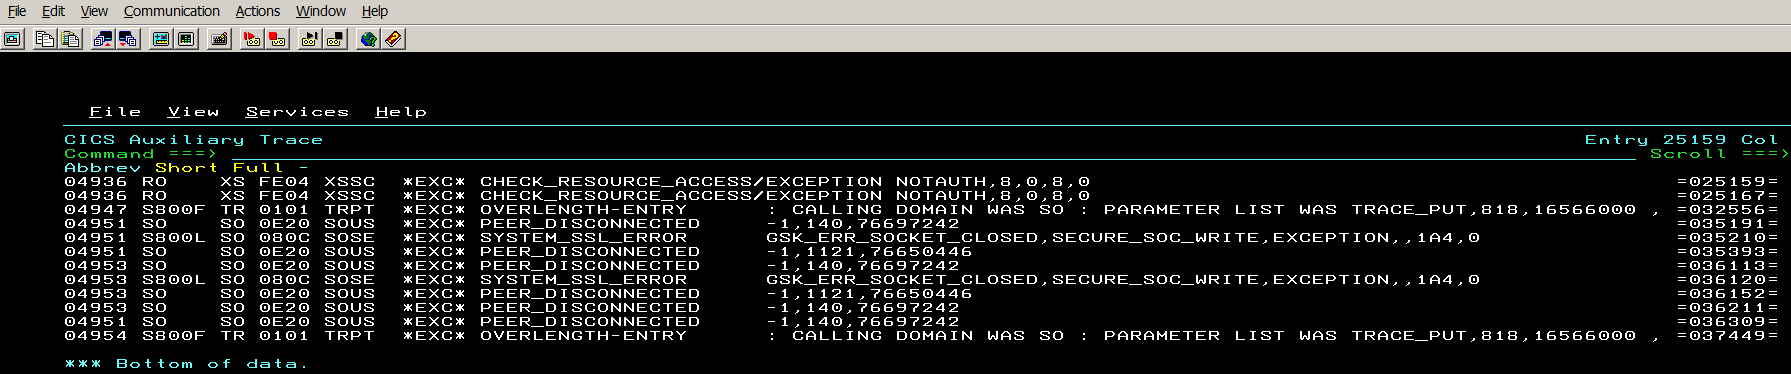
If you wanted to check out only the exception trace entries, you can specify that on the CICS Trace Selection Parameters screen, and end up with this:
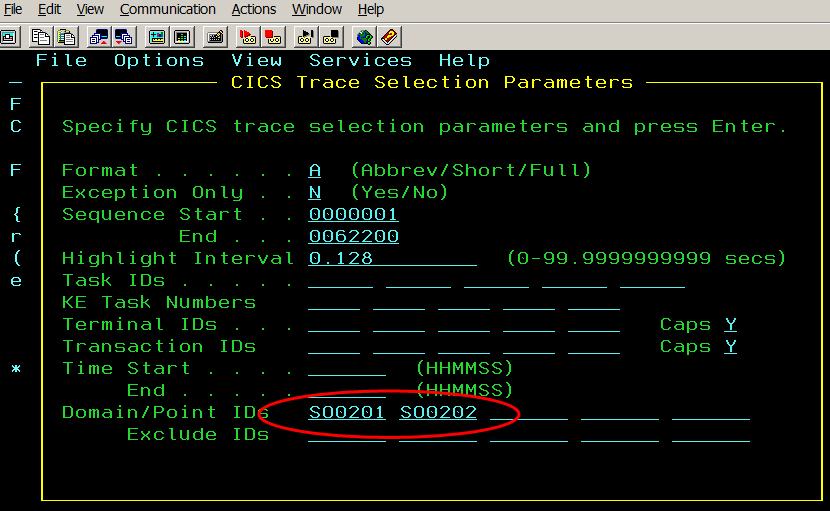
You can also quickly filter the trace and ask for only specific trace entries. For example, if you are trying to diagnose a TCP/IP related issue, and only want to look at the data coming in and going out on the sockets. You can specify those exact SO0201 and SO0202 trace entries on the CICS Trace Selection Parameters screen:
You then press the Enter key again, and toggle to the Full view, and end up with:
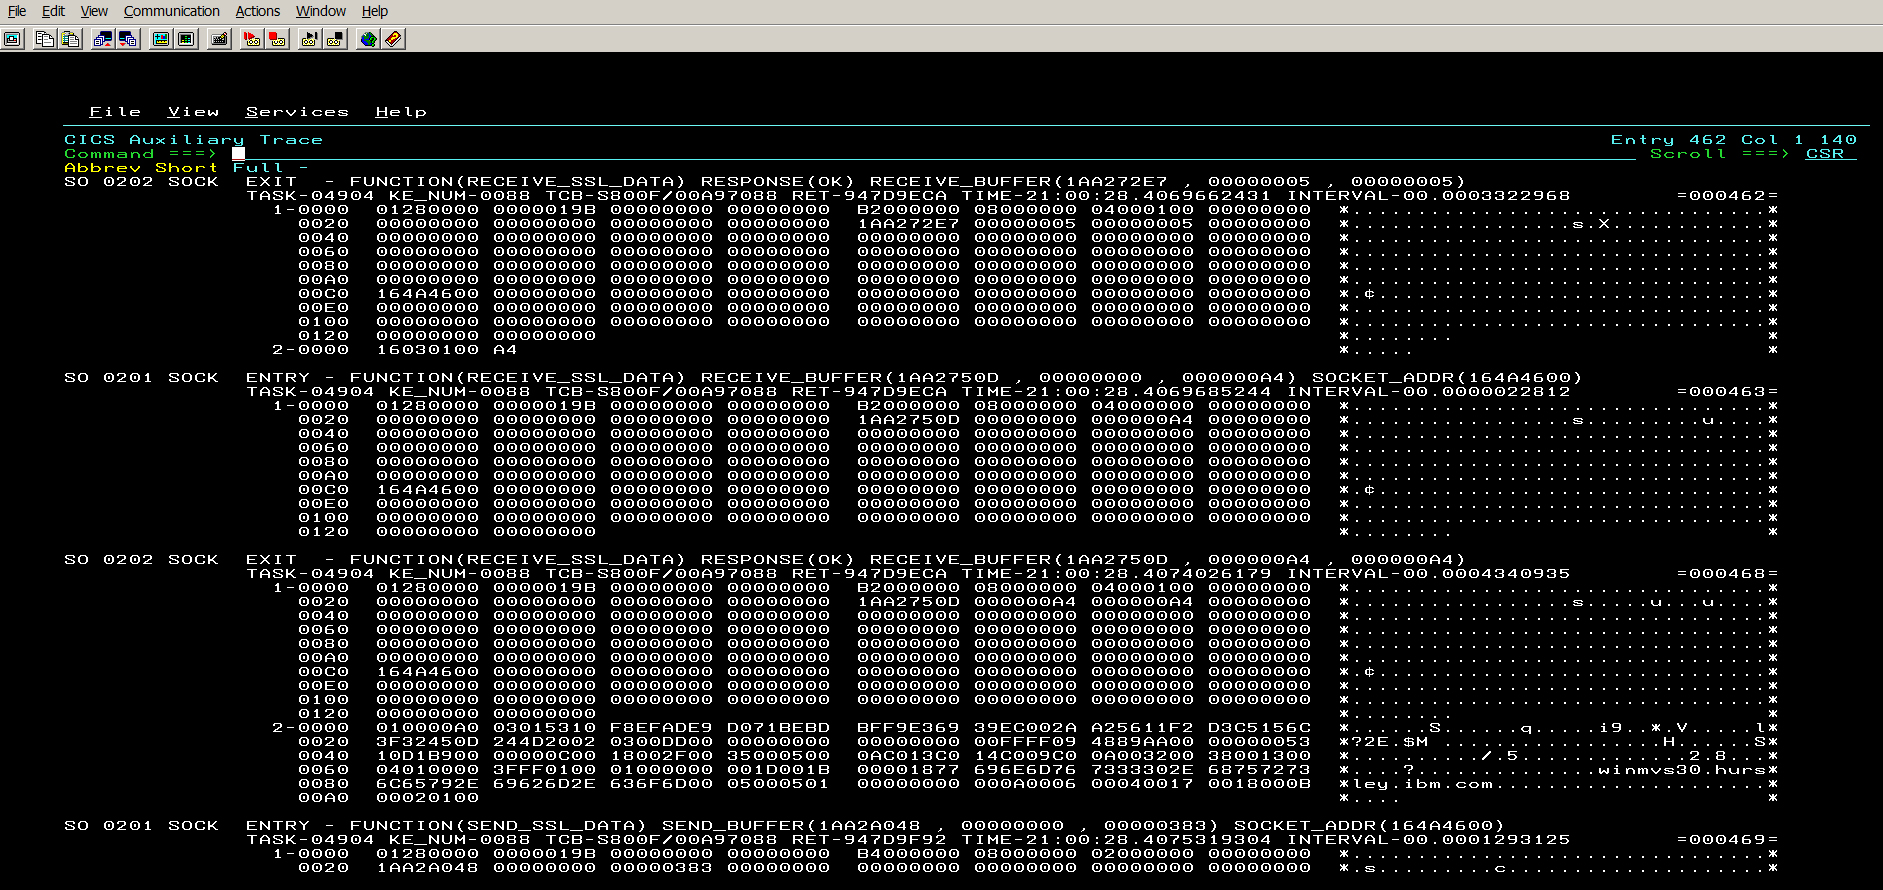
You're left with a clear view of the socket data being received and sent over the TCPIP port. In the above view, we can see that an SSL Handshake is about to get underway.
All of this is done interactively, without having to submit or wait for multiple batch jobs to complete. If you have a lot of traces to look at, this can be a big time-saver!
UID
ibm11080867