Over the 2016 Xmas break, I have been busy improving nmon and this is a summary with pictures:
1 New Performance Statistics
GPU
For the OpenPOWER people using the Nvidia GPUs within the S822LC machines we have the Graphical Processor Units and a previous AIXpert Blog covered the details but below is a little reminder:

These are the stats on-screen
- GPU MHz
- CPU and Memory Utilisation
- Temperature in C
- Electrical power in Watts
This is also saved to the nmon output file.
MHz
Below we now noticed the CPU cores in a single machine or VM can be running at different MHz ratings so we capture them On-screen and in the nmon file. On-screen is was tricky to decide how to display this so there are 3 modes on-screen - repeated hitting M (capital m for MHz) steps you through them in tern. This is the CPU core threads list:
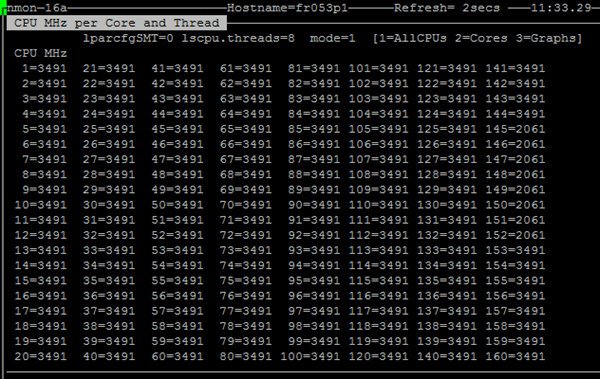
Note this machine is very busy and most CPU core threads are at 3491 MHz (roughly 3.5 GHz) but threads 145 to 152 are idling (this makes up one SMT=8 CPU core) at 2061 MHz (2 GHz).
Below there are just the CPU cores and now there are more cores at the slower MHz 2061.
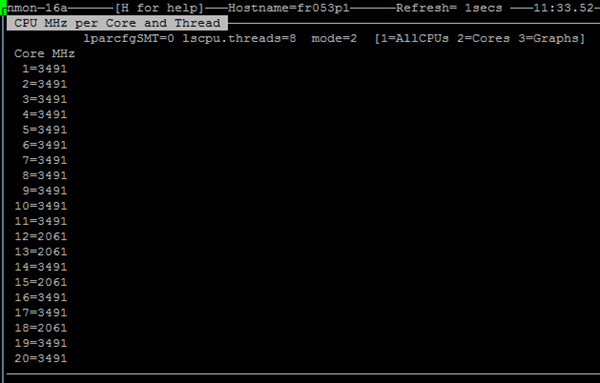
Then a final "M" and we get the same CPU core numbers but a graph format - so it is easy to spot fast and slow CPU cores.

Above obvious only 2 CPU cores are at the lower MHz
This POWER machine is sold at 2.92 GHz
When in Power Saving mode which drops to 2.0 GHz give the electrical power use is the square of the frequency which means the CPU is using half the electricity = a significant saving in electricity costs and cooling costs. When busy the CPU cores Over-clock to 3.5 GHz ~ 20% at no extra cost.
This is what the CPU Core Threads graph via nmonchart looks like:

OK that does look a little confusing as its a stacked chart of the MHz for all CPU core threads. The main problem is that it reported for all 80 threads and that it only ever has two values 2061 MHz and 3491 MHz. As this is the way it is reported but Linux in the /proc/cpuinfo file. An unstacked graph would not work as all the lines would be on top of each other. I may decide to only save the CPU core values as currently, all the threads on a particular core have the frequency. In this case, the 80 threads would drop to just the 10 POWER8 cores which is more manageable. The problem then is that on Intel / AMD CPUs the hyperthreading is very difficult to calculate and many of the statistics are reported clearly wrong.
Linux Utilisation categories
Classic UNIX has three categories plus Idle for CPU Utilisation:
- User = running programs, applications, or commands
- System = the UNIX Kernel running system calls or Interrupts
- Wait for I/O = This is the same as Idle but there is disk I/O outstanding (it shows a disk bottleneck but the CPUs are actually Idle waiting for data)
- Idle = the CPU has nothing to do
Linux over the years has added some more and currently has ten categories for CPU Utilisation as follows
- User = running programs, applications, or commands (like UNIX above)
- User Nice = As User but the processes have had their priority dropped using the nice command or system call
- System = the Linux Kernel running system calls but not Interrupts (see below Irq and Softirq)
- Idle = the CPU has nothing to do
- IO Wait = This is the same as Idle but there is disk I/O outstanding (it shows a disk bottleneck but the CPUs are actually Idle waiting for data)
- Irq = Kernel system time Handing Interrupt. I have seen embedded CPU Linux stats where the CPU is very largely interrupt driven so this is useful to highlight that.
- Softirq = Software Interrupt - these are like Interrupts but not driven from hardware event but by special CPU instruction to get CPU interrupted for the Kernel to take actions.
- Steal = Only applies to a Virtual Machine and highlights that the VM has runnable processes that can't run because the CPU is currently running a different VM. This VM effectively thinks someone else stole the CPU cycles. Over-committed CPUs in a highly virtualised environment can get a lot of this. These Steal stats highlight the issue.
- Guest - Only applies to a VM Hosting operating system like KVM or PowerKVM hypervisor environments - this CPU time is used running one or more of the hosted guest virtual machines. To the hosting OS, this is like User time - but within the VM it could be User, System or the other categories.
- Guest Nice = The same as the about Guest category above but the hosts are low priority.
As far as I can see you will never get all of these stats on a single Linux OS - like you may get steal - or - Guest utilisation numbers non-zero but never on the same machines - the OS is either a guest or a host. For years nmon has hidden the growing number and only displayed the original 4 but some of these are now genuinely useful!! So they are now on-screen or saved to the nmon file in addition to the UNIX view. On-screen you get:

Above the top line is the whole machine and below it the many CPU core thread stats.
It is done this way as my POWER machine I have 80 CPU core thread which are too many to show on the screen and the whole machine number disappear off the bottom but are probably the most interesting. Note there is 100% per CPU core thread - this could be removed by dividing by the numbers of CPU core threads but that results in lots of information going missing.
- a 100% tells you a CPU core thread is busy - if we user 100 / 80 = 1.2% it looks like noise
- having a number like 3400% informs you there is roughly 34 CPU cores worth of CPU time in used. If reported as 3400 /80 = 42% then you have to do the backward maths to get to 34 CPU core threads.
The Initial nmonchart graphs of this look like this below:
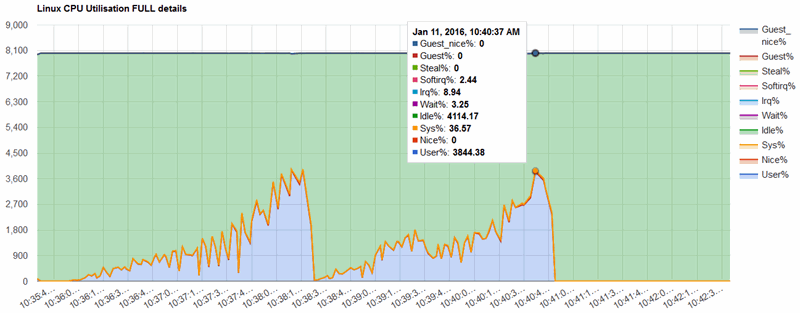
I hope to capture other machines with busy steal and guest numbers.
2 On-screen Face Lift
nmon for AIX has some challenges that we don't have with nmon for Linux when it comes to curses colour handling so I have been slowly adding colour to the on-screen panels to aid readability as we can group information by colour and highlight columns or rows.
The Welcome on-screen panel has the new logo:
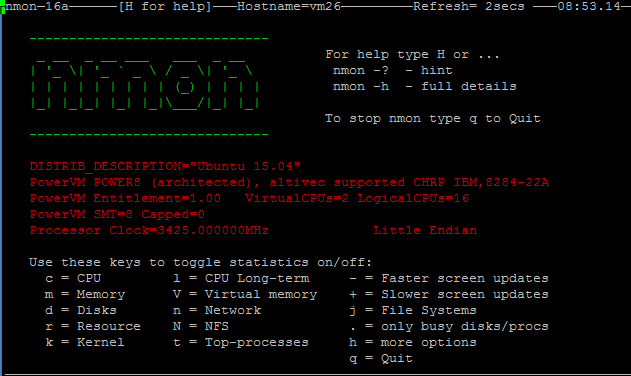
The Help panel looks like this in green:
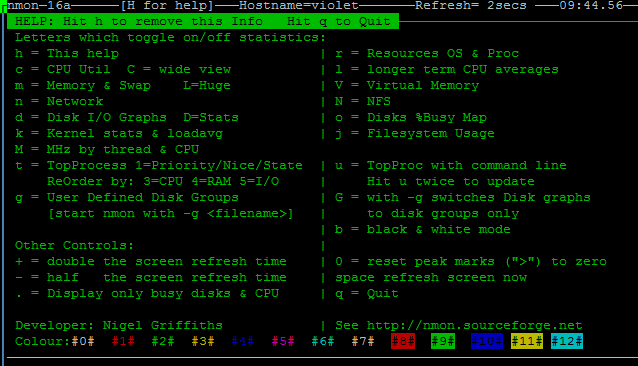
Note on the above the colour combinations we have to play with.
The CPU graphs have been colour for a few years as below:
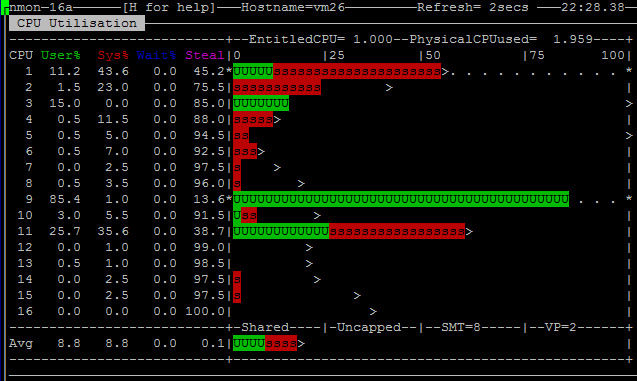
Now other data is coloured too
Resources:
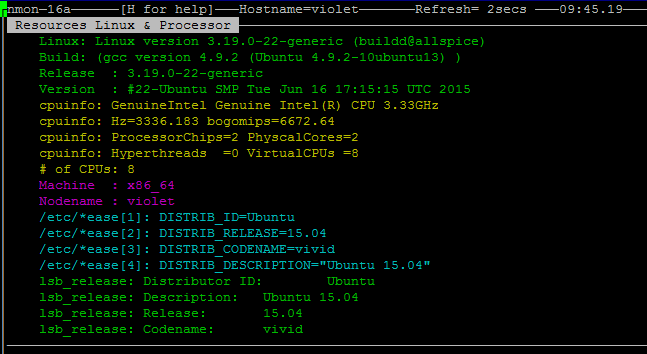
Memory

Kernel stats:

There are loads more - see the bottom link to all the current screen shots.
NEW Wide CPU View
When a 20 CPU core POWER8 Scale-out "low end" machine with SMT=8 presents 160 CPU core threads we have to rethink how data is displayed on the screen because not many people can show 160 lines of text that is readable. So we have a new wide view across the screen mini graphs layout for up to 192 CPU core threads. The display using C (uppercase c):
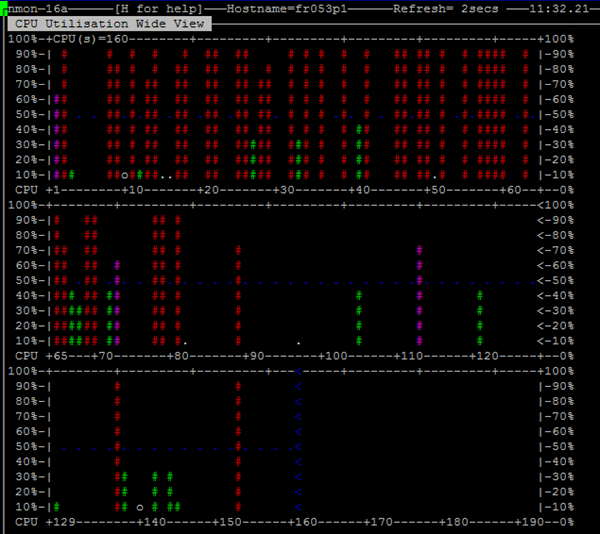
Above you can quickly determine your spare capacity and how Linux is spreading work across threads and cores.
3- Other Improvements
Improvement in nmon
- "lscpu" output is captured to the nmon file and also displays on screen
- internal code change to organise the command line option and key to change screen content
- nmon -h output rewritten - still rather cryptic but much better and assumes less.
- Kernel stats on screen new format
- Still working on formatting the boot time from the second since the epoch to the date time. The Uptime value overflows far too quickly now.
- Less time drift by allowing for nmon compute time for long-running data capture to file session.
- New Top Process functions to handle ordered by I/O of the processes (type: 4) (you have to be root for this to work due to a /proc quirk)
- Reduced screen artefacts with better cursors pad use.
- Automatic generation of User Defined Disk Groups using the lsblk command) to remove reporting of duplicated disk stats (/proc has both disk and disk partition stats mixed together). Use the option "-g auto" to enable for on-screen and capture to file. For the on-screen panel type: g
- Capture to file: If you use -g auto and the -D you also get more disk stats: disk wait time & disk service times, merges, in-flight I/O count & backlog
- JFS stats are more accurate and they know about the hidden block saved for root user - if your disks are large this can waste a lot of space!
More information:
- nmon for Linus download http://nmon.sourceforge.net/pmwiki.php?n=Site.Download
- nmonchart download http://nmon.sourceforge.net/pmwiki.php?n=Site.Nmonchart


