Question & Answer
Question
How to know if my memory is over-committed?
Cause
The over-commitment of memory is measured by the virtual memory, which is the computational memory also known as active virtual pages. We check if the value of the virtual memory is 98% of the total memory or more, then the system is over-committed in terms of memory.
Answer
Here is how to check it:
1- #vmstat -Itw
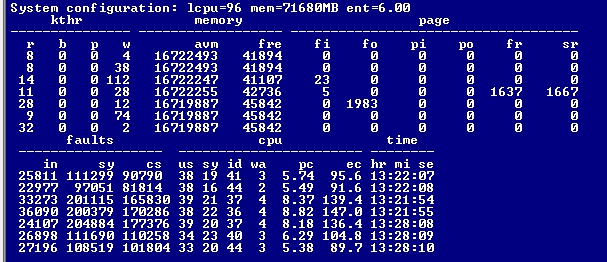
A- If we look at the avm column, we will find that the virtual memory is in 4K, therefore to get the value in MBs, we will divide the number by 256.
In the above example, the virtual memory usage is 16722493/256=65322MBs, which is about 91% of the total memory assigned to the LPAR. Therefore, this system is not over-committed in the terms of memory.
B- If we look at the fre column, this indicates how much free memory exists on the LPAR “This is the part of memory where the segments are completely free, with no computational or non-computational memory used”, if the value is very low in comparison to the total memory, then it is recommended that we increase the memory allocated to the LPAR for improved performance as it is also considered as a bottleneck.
C- %avm may look good but there still may be a shortage of memory showed in free memory. Another indicator is LRUD running and a large number of pages being scanned while few free pages are freed , LRUD running alone is not a memory issue but when the number of scans to frees is large and page outs begin this is an indicator. Another reason for the low free memory is a large number of pinned pages “non-computational” which is not shown in the above output of vmstat. Pinned memory and file cache are not reflected in the AVM figure.
2- #svmon -G for the system #svmon -P for each process

All the values above are in 4K as well, the virtual column shows the virtual memory used. Therefore, you can calculate it from here too, you will find that the percentage is the same like when we use #vmstat which is 91%. If you want to get the highest virtual memory processes on your system, you can use #svmon -P.
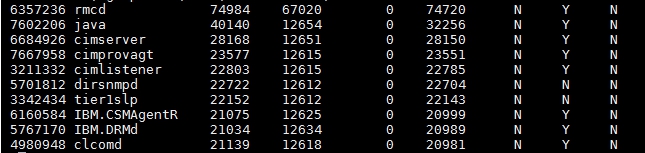
You can use this command to get the highest 10 virtual memory processes on your system:
#svmon -P |egrep " Y | N "| sort -rn +5| head
The output will look like this:

3- #topas
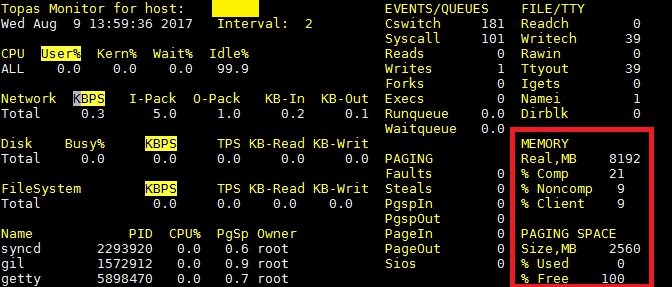
The output of topas shows us the memory as Computational percentage, which is the Virtual memory.
The screenshot shows us that the Computational percentage is 21%, this means that the system is not memory over-committed.
4- #nmon, then tapping “m”
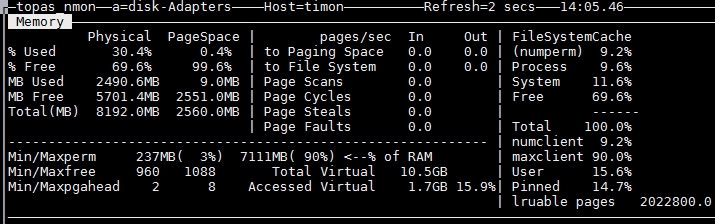
There is a wide misconception that the used% is the computational memory. The correct definition for the Used percentage is computational + non-computational. Therefore, you cannot confirm the over-commitment of your memory from nmon.
1- #vmstat -Itw
A- If we look at the avm column, we will find that the virtual memory is in 4K, therefore to get the value in MBs, we will divide the number by 256.
In the above example, the virtual memory usage is 16722493/256=65322MBs, which is about 91% of the total memory assigned to the LPAR. Therefore, this system is not over-committed in the terms of memory.
B- If we look at the fre column, this indicates how much free memory exists on the LPAR “This is the part of memory where the segments are completely free, with no computational or non-computational memory used”, if the value is very low in comparison to the total memory, then it is recommended that we increase the memory allocated to the LPAR for improved performance as it is also considered as a bottleneck.
C- %avm may look good but there still may be a shortage of memory showed in free memory. Another indicator is LRUD running and a large number of pages being scanned while few free pages are freed , LRUD running alone is not a memory issue but when the number of scans to frees is large and page outs begin this is an indicator. Another reason for the low free memory is a large number of pinned pages “non-computational” which is not shown in the above output of vmstat. Pinned memory and file cache are not reflected in the AVM figure.
2- #svmon -G for the system #svmon -P for each process
All the values above are in 4K as well, the virtual column shows the virtual memory used. Therefore, you can calculate it from here too, you will find that the percentage is the same like when we use #vmstat which is 91%. If you want to get the highest virtual memory processes on your system, you can use #svmon -P.
You can use this command to get the highest 10 virtual memory processes on your system:
#svmon -P |egrep " Y | N "| sort -rn +5| head
The output will look like this:
3- #topas
The output of topas shows us the memory as Computational percentage, which is the Virtual memory.
The screenshot shows us that the Computational percentage is 21%, this means that the system is not memory over-committed.
4- #nmon, then tapping “m”
There is a wide misconception that the used% is the computational memory. The correct definition for the Used percentage is computational + non-computational. Therefore, you cannot confirm the over-commitment of your memory from nmon.
Correction: Top right has Process=9.6% and System=11.6% which is the Computational memory=21.2%.
Non-computational Filesystem Cache(numperm)=9.2% + Free=69.9% total=78.8%
5- #lsps -a

The paging space is an indicator for memory over-commitment as well. The system starts paging out when the computational memory usage reaches 98% of the total physical memory and goes beyond that percent. If the paging space usage is high, this means the system has been paging out and it is recommended that you start investigating the memory.
Non-computational Filesystem Cache(numperm)=9.2% + Free=69.9% total=78.8%
5- #lsps -a
The paging space is an indicator for memory over-commitment as well. The system starts paging out when the computational memory usage reaches 98% of the total physical memory and goes beyond that percent. If the paging space usage is high, this means the system has been paging out and it is recommended that you start investigating the memory.
Related Information
[{"Product":{"code":"SWG10","label":"AIX"},"Business Unit":{"code":"BU058","label":"IBM Infrastructure w\/TPS"},"Component":"Not Applicable","Platform":[{"code":"PF002","label":"AIX"}],"Version":"Version Independent","Edition":"","Line of Business":{"code":"LOB08","label":"Cognitive Systems"}}]
Was this topic helpful?
Document Information
Modified date:
03 December 2019
UID
isg3T1025606