Troubleshooting
Problem
This document describes how to enable connection pool tracing for Websphere Application Server
Resolving The Problem
For releases of V9.0, V8.5, V8, and V7:
| 1. | In the Application Server Administrative Console, expand Troubleshooting and select Logs and Trace. |
| 2. | In the Logging and Tracing page, select your server and then select Diagnostic Trace. |
| 3. | Ensure that Enable Log is selected. |
| 4. | Under Trace Output, select File, and ensure the appropriate file size and number of historical file saved are set accordingly. It is recommended to set the number of historical trace files to 20 and the size of each historical trace file to 50MB. |
| 5. | Click OK, and save your configuration. |
| 6. | Again, expand Troubleshooting, and select Logs and Trace. |
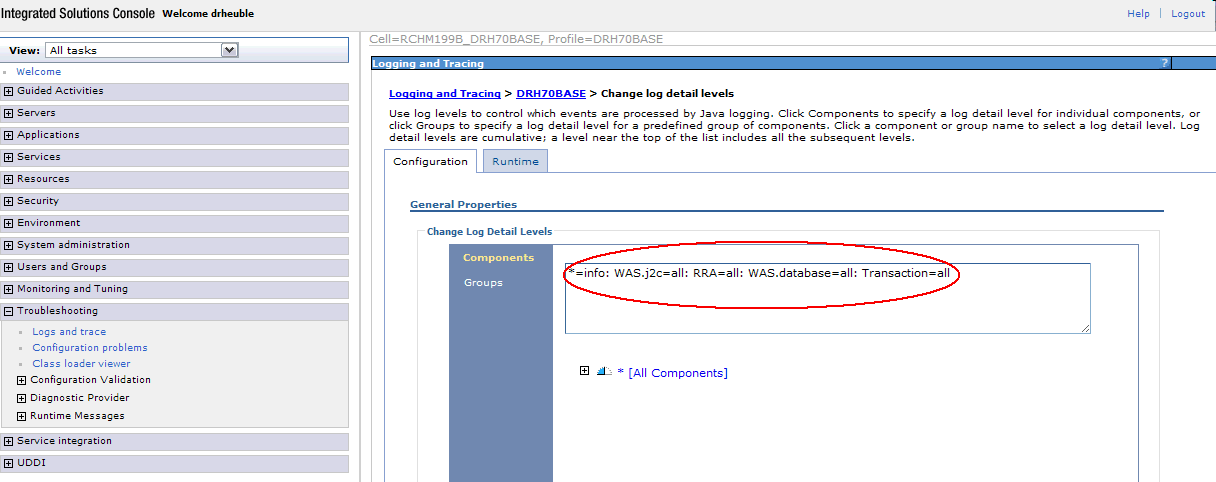
| 7. | In the Logging and Tracing page, select your server and select Change Log Detail Levels. |
| 8. | Enter the following trace string on either the Configuration or Runtime tabs: *=info:WAS.j2c=all:RRA=all:Transaction=all |

For connection pooling problems, you should use the following MustGather document:
MustGather: Connection Pooling Problems
[{"Type":"MASTER","Line of Business":{"code":"LOB57","label":"Power"},"Business Unit":{"code":"BU058","label":"IBM Infrastructure w\/TPS"},"Product":{"code":"SWG60","label":"IBM i"},"Platform":[{"code":"PF012","label":"IBM i"}],"Version":"7.1.0"}]
Historical Number
582445335
Was this topic helpful?
Document Information
Modified date:
18 December 2019
UID
nas8N1011851