IBM Support

AIX: Installing InfluxDB 1.8 and Grafana 7

How To


Summary

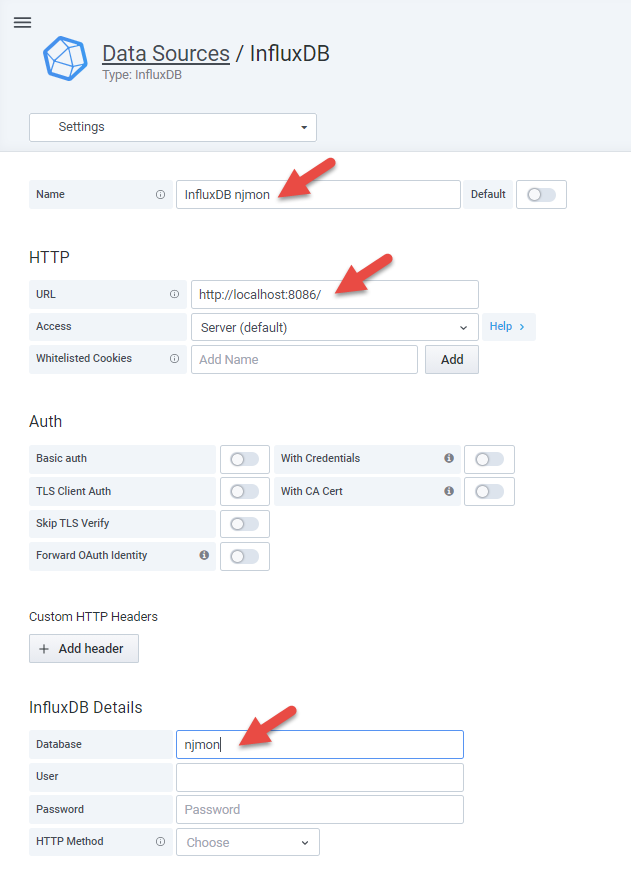
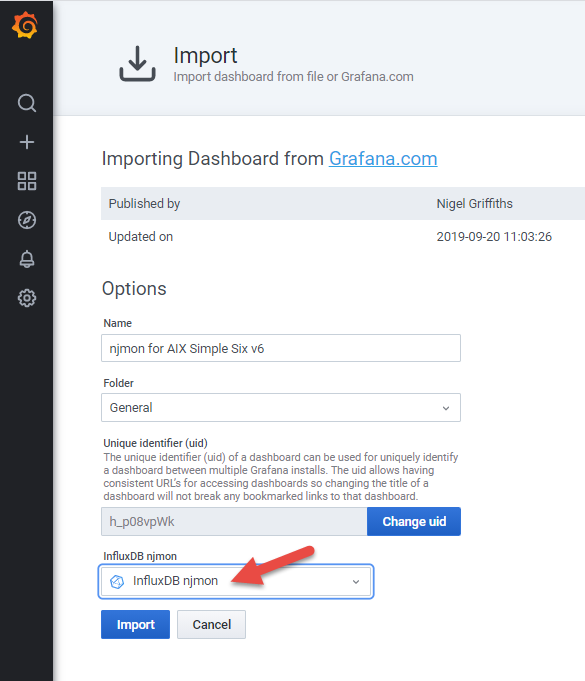
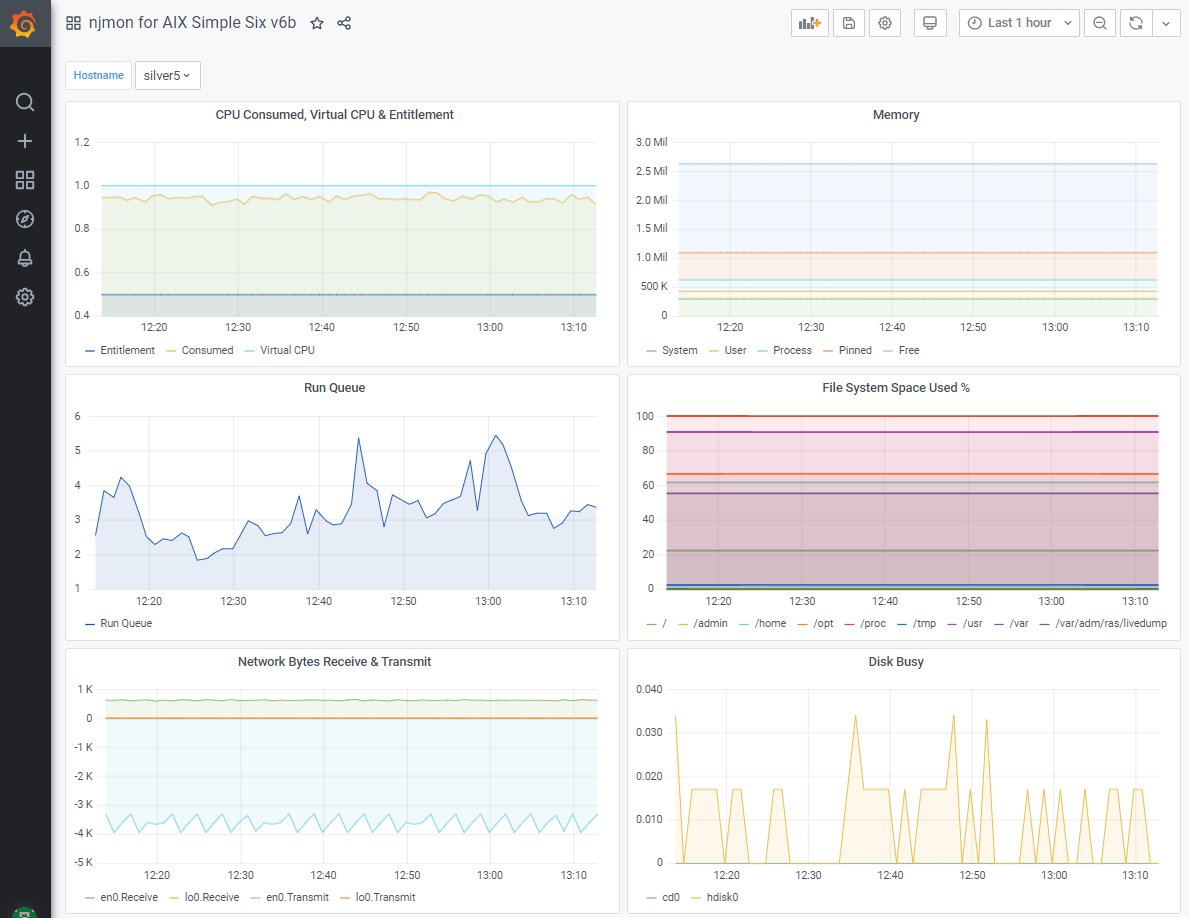
When I show technical folk my njmon performance tool and InfluxDB with Grafana, they assume that must be complicated to set up but it is not true. Thanks to amazing team are power-devops.com who compiles both tools for AIX on POWER8 and POWER9. InfluxDB is simple and quick to install. Then, you have the best Time-series database and browser-based performance stats graphing tool, ready for njmon data and on the best Operating System - AIX. I estimate all the tasks in this blog take 10 to 15 minutes. You can cut'n'paste most of the commands directly.

Objective

Nigels Banner

Environment

Assuming the following environment:
  1. A freshly installed AIX 7.2 TL4 or higher on a POWER8 or POWER9 server.
    Note: InfluxDB is written in Go. GO is a recent (2019 I think) recompile & port to POWER.  Go is not supported on older generations of POWER servers like POWER7 or POWER7+.
  2. Already have "yum" is installed, which is used to install "wget".  If not installed see other AIXpert blogs on how to install the AIX "Yum Bundle".
  3. You would like to put the InfluxDB data in a separate file system and you have AIX system admin basic skills like: smitty, Volume Groups, Logical Volumes and JFS2.
  4. Internet access from the AIX server.  Alternatively, you could copy the installation files by hand.
  5. Latest versions for AIX are (at the time of writing this blog) InfluxDB 1.8.3.1 and Grafana 7.3.1.1.
    Find the latest versions here https://www.power-devops.com/influxdb and https://www.power-devops.com/grafana
  6. You use /etc/rc.local for starting boot time applications.
  7. The root user is used throughout.

Steps

1) Create a /var/lib/influxdb file system for the InfluxDB data
It was assumed you know how to do this already but here are some reminders:
  • lspv
  • smitty lvm   # create a high-speed Logical Volume (LV)
  • smitty jfs2  # add a Journal File System 2 (JFS2) in to the LV 
  • mount /var/lib/influxdb
  • df -g
2) Install wget
Assuming you have yum setup - crazy not too!
yum install wget
3) Fetch the Influxdb software, install it and start it
This is the simple part
wget https://dl.power-devops.com/powerdevops.influxdb.1.8.3.1.bff.gz
gunzip powerdevops.influxdb.1.8.3.1.bff.gz

installp -acgXYd powerdevops.influxdb.1.8.3.1.bff all

/etc/rc.d/init.d/influxdb start

ps -ef | grep influx | grep -v grep
4) Create the njmon database within InfluxDB for data and check that worked
Create the njmon database within InfluxDB
influx <<EOF
create database njmon
EOF
Check that it worked
influx <<EOF
show databases
EOF
5) Fetch the Grafana software, install it and start it
This is the second simple part
wget https://dl.power-devops.com/powerdevops.grafana.7.3.1.1.bff.gz
gunzip powerdevops.grafana.7.3.1.1.bff.gz

installp -acgXYd powerdevops.grafana.7.3.1.1.bff all

/etc/rc.d/init.d/grafana start

ps -ef | grep graf
6) Fetch the latest njmon for AIX agent, install it and start it
We are going to use the nimon variation of njmon, which directly injects the data in to InfluxDB skilling the JSON file format.
You have to find the latest version as it is regularly updated. The package filenames can be found here:
wget http://sourceforge.net/projects/nmon/files/njmon_aix_binaries_v69.zip
unzip njmon_aix_binaries_v69.zip

./ninstall
Get nimon started at reboot time via rc.local and start now

echo nimon -s 30 -k -i localhost -p 8086 -x njmon -n >>/etc/rc.local

# Start now
nimon -s 30 -k -i localhost -p 8086 -x njmon -n
For failsafe restarting hourly. If nimon is already running it stops itself, so no harm is done. 
Start nimon every hour (if it stopped for some reason like a reboot). Add this line to cron using the command: crontab -e
0 * * * * /usr/lbin/nimon -s 30 -k -i localhost -p 8086 -x njmon -n
7) Get InfluxDB and Grafana to start on reboot
ln -s /etc/rc.d/init.d/influxdb /etc/rc.d/rc2.d/Sinfluxdb 
ln -s /etc/rc.d/init.d/influxdb /etc/rc.d/rc2.d/Kinfluxdb
ln -s /etc/rc.d/init.d/grafana /etc/rc.d/rc2.d/Sgrafana
ln -s /etc/rc.d/init.d/grafana /etc/rc.d/rc2.d/Kgrafana
- - - Everything is now set up and collecting data- - -
8) Added nimon to other servers
You need to repeat the nimon installation for other AIX servers but change "localhost" to the hostname (or IP address) of your InfluxDB service.  I am a network administrator, so I added a network hostname alias of "influx" to make life simple.  So for example to hand start nimon I use:
nimon -s 30 -k -i influx -p 8086 -x njmon -n
There are two tasks with Grafana to see the graphs
A) Creating a Grafana Data Source to the InfluxDB
Assuming the server running Grafana hostname is as follows:
$ hostname
myserver.mycompany.com
  1. Browse to https://myserver.mycompany.com:3000
  2. Log in with user admin and password admin
  3. Change admin password - optional
  1. Go to Configure - Data Source 
    Configure Data Source
  2. Click "Add Data Source"
    Add
  3. Select InfluxDB
    Select InfluxDB
  4. Type a good name like: "InfluxDB njmon", add URL "http://localhost:8086" and Database "njmon"
    add fields
  5. Scroll down and click "Save & Test"
    Save
  6. If the details are correct, it displays a green "Data source is working" message.
  7. Your Grafana is connected to your InfluxDB
B) Import a njmon & nimon Dashboard for your server type AIX (or Linux)
  1. Prepare to Import a Dashboard
    Select Import Dashboard
  2. Type "10891" in to the Import from Grafana.com field the click "Load"
    add the ID and Load
     
  3. Select the Data Source from the list and click "Import"
    select the database
  4. You are now looking at a Grafana Dashboard for your server with six simple graphs covering CPU, memory user, run queue, file system use, disk I/O and network I/O.  Here is a mine - after a half hour of collecting performance statistics, so there are more data points.
    the graphs
   Stand back in awesome wonder!   
You can add further pre-prepared Dashboards and create your own Graphs of the njmon or nimon performance statistics.
For more information and links to YouTube videos about njmon and nimon go here:  http://tinyurl.com/njmon

Additional Information


Find more content from Nigel Griffiths (retired) here:

Document Location

Worldwide

[{"Line of Business":{"code":"LOB08","label":"Cognitive Systems"},"Business Unit":{"code":"BU058","label":"IBM Infrastructure w\/TPS"},"Product":{"code":"SWG10","label":"AIX"},"ARM Category":[{"code":"","label":""}],"Platform":[{"code":"PF002","label":"AIX"}],"Version":"All Versions"}]

Document Information

Modified date:
09 June 2023

UID

ibm16369161