Use Analytics Service to calculate essential key performance indicators for your organization from your IoT and non-IoT data.
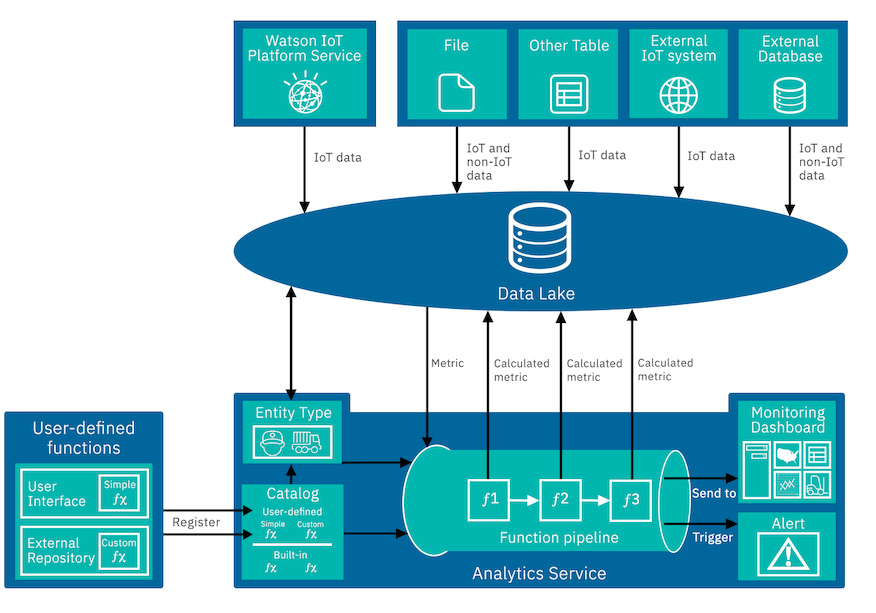
The following diagram illustrates how the basic components of Analytics Service are connected:
The diagram shows that input data is ingested or loaded into the data lake from various sources, such as through the Platform Service, from CSV files, from external IoT systems, and from database tables.
Analytics Service performs calculations on the data in the data lake every 5 minutes, by default. The output data from these calculations is added to the data lake where it is available for analysis or as input to other calculations.
Several built-in functions are available in a function catalog for you to apply to your device types. The functions are written to apply across multiple calculations. You configure the input and output parameters to meet the requirements of your device type or your environment before you use a function in a calculation.
If the built-in functions do not meet all of your requirements, write your own custom code. You can add expressions and simple functions by pasting the code into a function in the user interface. Alternatively, for testing purposes, you can store a simple function in a local model store and register it with the catalog. If your function is too large to paste into the user interface or if your function has multiple outputs, store your function in a GitHub repository and register it with Analytics Service.
Functions are run automatically as part of a function pipeline. The output of some functions feeds into the other calculations. Analytics Service determines the order in which to process calculations.
One source of input data is metric data from IoT devices that was ingested by Platform Service and stored in the data lake.
Other sources of input data are IoT and non-IoT data that you load for devices into the data lake from external systems, databases, and files using some of the built-in functions in Analytics Service.
For information about how to add data to the data lake, see Adding data from other sources.
Devices are modeled as assets in Analytics Service. Entities are the digital representation of items in your organization that either produce data or that you would like to track by using data. For example, assets can be vehicles, industrial equipment, homes, or workers.
Each piece of data in Analytics Service is referred to as a data item.
Input data items include:
When you add a calculation, a calculated data item is created as an output:
Explore the function catalog to see the range of built-in functions that are available to you. Create some sample data and explore the calculations that are associated with each template.
Any KPI that is labeled (calculated) was calculated by Analytics Service.
A set of built-in, sample and base functions are available in a companion package, IoT Functions, in GitHub Enterprise. You can derive your custom functions from the functions in this package.
Apply functions from the catalog to a device type. Configure the inputs and outputs of each calculation to adapt the calculation to suit the device type and your environment. You can aggregate your view of the metric data using time-based granularities, such as weekly, daily, monthly. Alternatively, you might use a dimension, such as manufacturer or location, as a grain.
Analytics Service builds a pipeline of functions. For example, you might configure two functions, ƒ1 and ƒ2. If ƒ1 is used in the calculation of ƒ2, ƒƒ is run first.
Explore the data items that are produced as outputs of your calculations from the Monitor tab in Analytics Service.
For more information, see Working with calculations.
You can create alerts and configure them to trigger when your data reaches or exceeds a specific threshold. For more information, see Configuring alerts.
You can use some of the built-in anomaly detection functions to find patterns in your time series data that do not confirm to expected behavior. For example, you can use the NoDataAnomalyScore function to alert you when your sensors are
no longer sending data. You can add alert information to your line graph cards to easily find the data points that are anomalous. For more information, see Detecting anomalies.
Anomaly simulator functions are provided in the function catalog for simulating anomalies. You can use the simulator to become familiar with unsupervised anomaly detectors. For more information, see Simulating anomalies.
Visualize your input and calculated metrics and alerts for your assets in monitoring dashboards. Configure summary dashboards for business users to monitor their line-of-business KPIs. Configure device dashboards to monitor metrics and alerts for individual assets. For more information, see Monitoring dashboards.
By default, coordinated Universal Time (UTC) is used on dashboards. You change the timestamp that is used for a device type through a REST API. For more information, see Setting the timestamp.