How to create a Distributed Report
Guardium offers a function that provides a way to automatically gather data from all or a subset of the Guardium managed units that are associated with a particular Guardium Central Manager.
About this task - In this example, we see how to get a broader view and correlation insight for Exceptions (for example, SQL Errors) that are recorded on specific collectors.
Summary of steps
Prerequisites – create group of Managed Units via the Central Management screen.
Create Distributed Report.
Review the data gathered.
Create additional summary reports on the data gathered.
Procedure
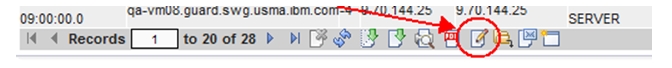
- Click
- Click New.
- Select Based on Report from the list (the
list shows the User-Defined Reports). For this example, choose Exceptions
Details.
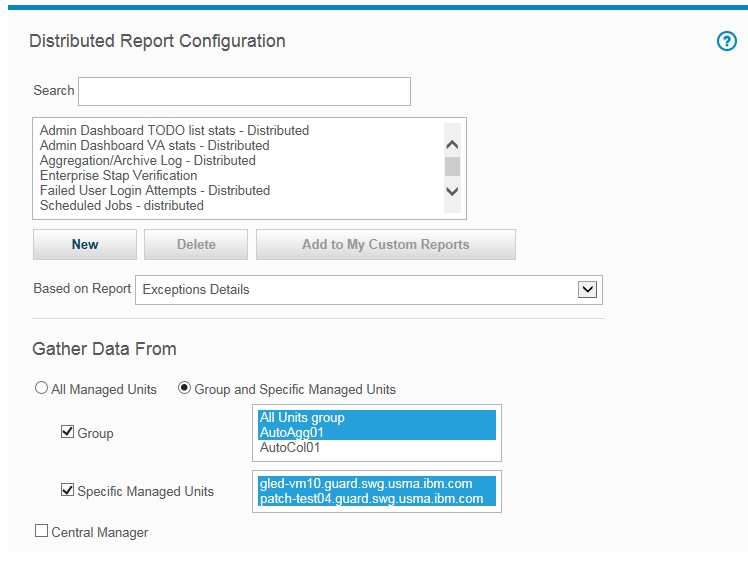
- Move down the screen to specify the Managed Units to be included in this distributed report. For this example, choose two groups from the Group list and in addition a few managed units from the Managed units list. In this example, leave the ‘Central Manager’ unchecked (in the case the Central Manager is also an Aggregator, it might need to be included).
- The next screen capture shows the setting for the Operation Mode.
The Immediate mode is mainly for online / real-time monitoring, such
as, view the recent Failed Login Attempts, view recent Excessive Exception,
or view real-time alerts. The Scheduled mode is an ongoing data-gathering
that runs periodically based on the Schedule defined. This example
summarizes the exceptions every hour. There is a requirement for filling
in values for Exception Description and Destination Address.
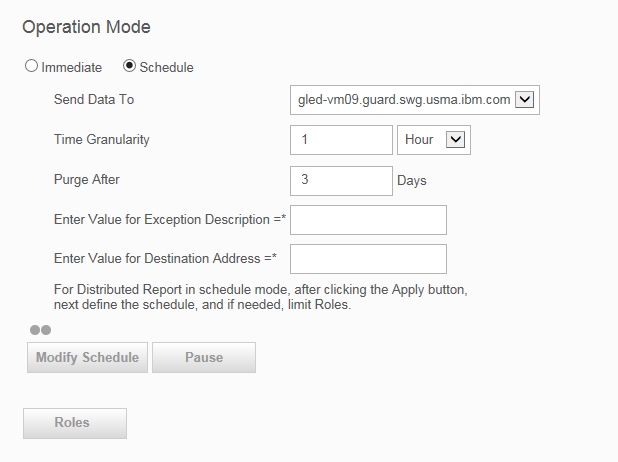
- Click Apply to create the Distributed Report.
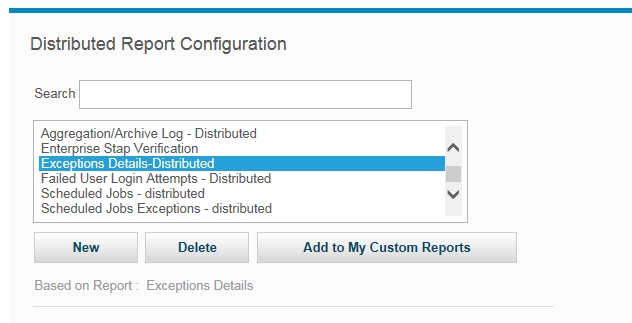
- Once applied, the new Distributed Report is added and highlighted
in the list box.
- The next step is to schedule it by clicking Modify
Schedule (this is mandatory to activate the process).
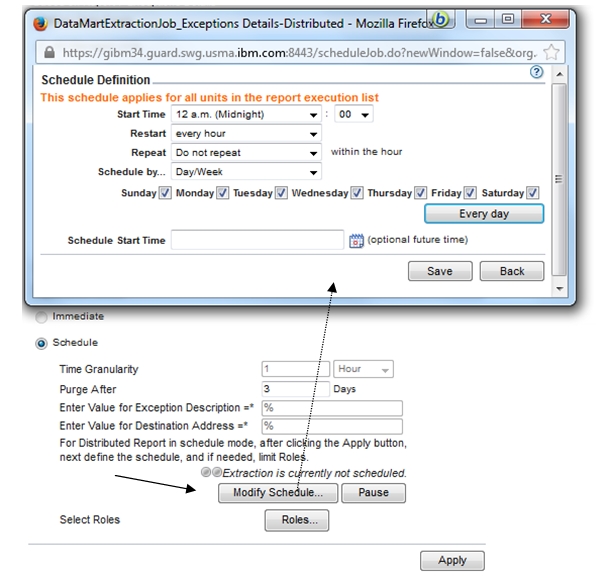
- This report can be limited to specific roles by clicking Roles and selecting the relevant Roles.
- In this specific example, the report is performed hourly - there
is no need to wait at least an hour to get the initial results. Note: The line saying ‘Distributed Report status – click here for details’, shows the status of data gathering, if data is missing from managed units then the line is colored in red; clicking the line navigates to details report of status per units per hour.
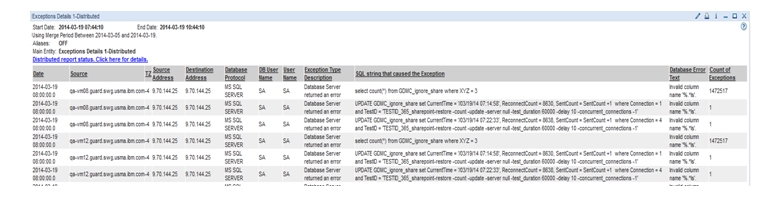
- The data is gathered from all the specified Managed Units and
stored in new designated entity (table). This entity is now available
via the Query Builder and Report Builder to create additional Queries
and Reports against this new table. The option to build additional
Queries and Report are available via the Distributed Report result
screen as well. Click Edit the query for this report.
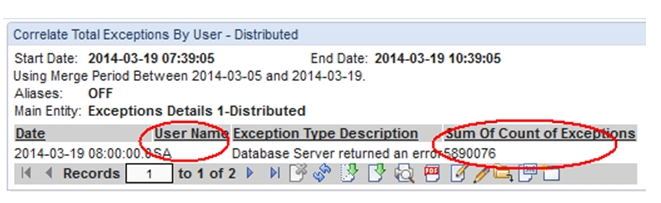
This default Report cannot be changed, click Clone, name it, remove all attributes and leave the Date, User Name, Exception Type Description, and Sum Of Count Of Exceptions.
The following screen capture shows an example of the Correlate Total Exceptions By User (Distributed). This view sum the total exceptions per user from all databases that are associated to the Guardium Managed Units selected for this Distributed Report. Likewise, you can view the Total Failed Login Attempts system wide, or the Total Exceptions per Source Programs.