SpssLabels Class (Python)
The SpssLabels class provides access to the row labels and column labels contained in a pivot table. You need to use this object to format column or row labels (for example, making all "Total" labels bold) or to change labels (for example, changing the "Column %", "Row %" or "Total %" label). Generally speaking, you need to get the specified column or row label in order to locate specific statistics in an SpssDataCells object.
The row and column labels are represented as 2-dimensional arrays, referred to as the row labels array and column labels array. The arrays contain all row and column labels for the pivot table, including hidden labels. The row labels array has the same number of rows as the data cells array and the column labels array has the same number of columns as the data cells array. Row indexes for the row labels and column indexes for the column labels respectively correspond to the row and column indexes for the data cells.
Column Labels Array
The following diagrams illustrate how the column labels array is indexed. Note that where you see only one label (such as the dimension name Statistics) in the pivot table, the label can be accessed in all cells corresponding to the categories under it. In the case of Statistics, you can access it using (0,0), (0,1), (0,2), (0,3), (0,4) or (0,5) and any change you make to one cell is reflected in all these cells.
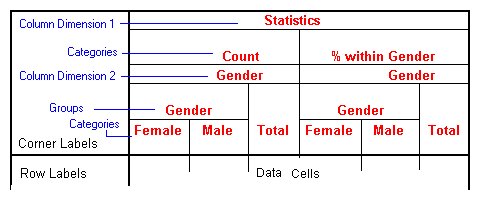
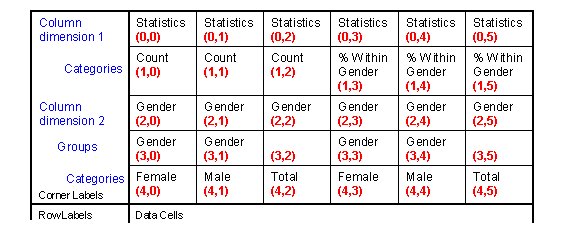
Each column dimension in the column labels array is represented by a set of levels. The first level is the dimension label, the last level contains the category labels, and all the levels in between (if any) contain group labels.
Row Labels Array
The following diagrams illustrate how the row labels array is indexed. Note that where you see only one label (such as the dimension name Statistics) in the pivot table, the label can be accessed in all cells corresponding to the categories under it. In the case of Statistics, you can access it using (0,0), (1,0), (2,0), (3,0), (4,0) and (5,0) and any change you make to one cell is reflected in all these cells.
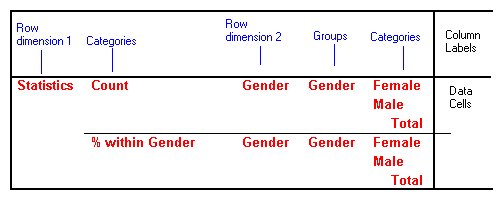
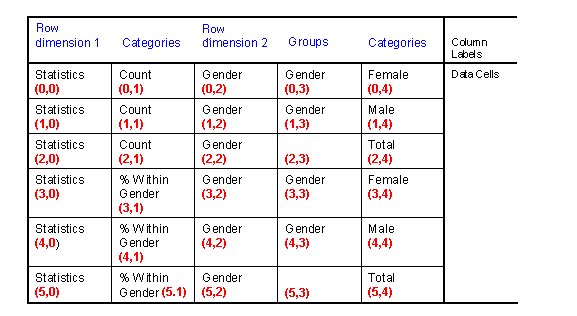
Each row dimension in the row labels array is represented by a set of levels. The first level is the dimension label, the last level contains the category labels, and all the levels in between (if any) contain group labels.
Notes
- To see all row and column labels in a pivot table, double-click on it and select View>Show All in the pivot table editor.
- Blank cells in the row label or column label arrays indicate that some categories (or subgroups) are not grouped.
Getting an SpssLabels Object
You get an SpssLabels object from the RowLabelArray or ColumnLabelArray method of an SpssPivotTable object, as in:
SpssLabels = SpssPivotTable.RowLabelArray()Examples
This example assumes that PivotTable is an SpssPivotTable object, selects all row labels and bolds the text.
RowLabels = PivotTable.RowLabelArray()
for i in range(RowLabels.GetNumRows()):
   for j in range(1,RowLabels.GetNumColumns()):
      RowLabels.SetTextStyleAt(i,j,
         SpssClient.SpssTextStyleTypes.SpssTSBold)
This example assumes that PivotTable is an SpssPivotTable object, selects all column labels and bolds the text.
ColLabels = PivotTable.ColumnLabelArray()
for i in range(1,ColLabels.GetNumRows()):
   for j in range(ColLabels.GetNumColumns()):
      ColLabels.SetTextStyleAt(i,j,
         SpssClient.SpssTextStyleTypes.SpssTSBold)