Comparing Column Proportions
This example uses the data file survey_sample.sav. See the topic Sample Files for more information.
The column proportions tests are used to determine the relative ordering of categories of the Columns categorical variable in terms of the category proportions of the Rows categorical variable. For example, after using a chi-square test to find that Labor force status and Marital status are not independent, you can find out which rows and columns are responsible for this relationship.
- From
the menus, choose:
- Click Reset to restore the default settings to all tabs.
- In the table builder, drag and drop Labor force status from the variable list into the Rows area of the canvas pane.
- Drag and drop Marital status from the variable list into the Columns area.
- Select Labor force status and click Summary Statistics in the Define group.
- Select Column N % in the Statistics list and add it to the Display list.
- Deselect Count from the Display list.
- Click Apply to Selection.
- In the Custom Tables dialog box, click the Test Statistics tab.
- Select Compare column proportions (z-tests).
- Click OK to create the table and obtain the column proportions tests.
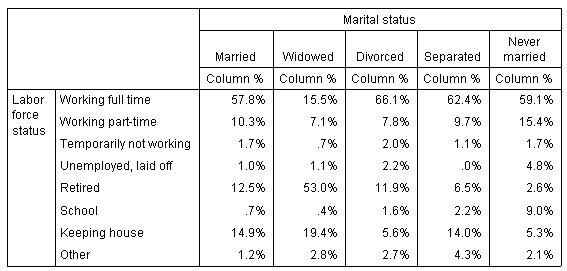
This table is a crosstabulation of Labor force status by Marital status, with column proportions shown as the summary statistic.
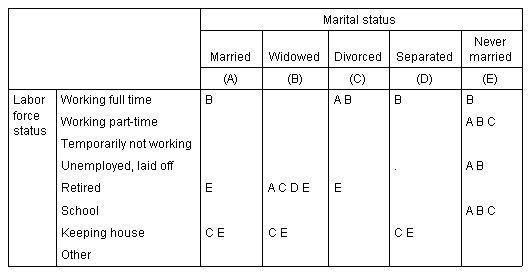
The column proportions test table assigns a letter key to each category of the column variables. For Marital status, the category Married is assigned the letter A, Widowed is assigned the letter B, and so on, through the category Never married, which is assigned the letter E. For each pair of columns, the column proportions are compared using a z test. Seven sets of column proportions tests are performed, one for each level of Labor force status. Since there are five levels of Marital status, (5*4)/2 = 10 pairs of columns are compared in each set of tests, and Bonferroni adjustments are used to adjust the significance values. For each significant pair, the key of the smaller category is placed under the category with the larger proportion.
For the set of tests associated with Working full time, the B key appears in each of the other columns. Also, the A key appears in the C column. No other keys are reported in other columns. You can conclude that the proportion of divorced persons who are working full time is greater than the proportion of married persons working full time, which in turn is greater than the proportion of widowers working full time. The proportions of people who are separated or never married and working full time cannot be differentiated from people who are divorced or married and working full time, but these proportions are greater than the proportion of widowers working full time.
For the tests associated with Working part time or School, the A, B, and C keys appear in the E column. No other keys are reported in other columns. Thus, the proportions of people who have never been married and are in school or are working part time are greater than the proportions of married, widowed, or divorced people who are in school or working part time.
For the tests associated with Temporarily not working or with Other labor status, no other keys are reported in any columns. Thus, there is no discernible difference in the proportions of married, widowed, divorced, separated, or never-married people who are temporarily not working or are in an otherwise uncategorized employment situation.
The tests associated with Retired show that the proportion of widowers who are retired is greater than the proportions of all other marital categories who are retired. Moreover, the proportions of married or divorced people who are retired is greater than the proportion of never-married persons who are retired.
There are greater proportions of people married, widowed, or separated and keeping house than proportions of people divorced or never married and keeping house.
The proportion of people who have never been married and are Unemployed, laid off is higher than the proportions of people who are married or widowed and unemployed. Also, note that the Separated column is marked with a ".", which indicates that the observed proportion of separated people in the Unemployed, laid off row is either 0 or 1, and therefore no comparisons can be made using that column for unemployed respondents.
Merging Significance Results into the Main Table
If you do not want the significance results in a separate table, you can choose to display them in the main table. Complete the previous steps for comparing column proportions, but make the following change on the Test Statistics tab:
- In the Identify Significant Differences area, select In the main table.
- Click OK to create the table.
Figure 3. Significance results merged into main table 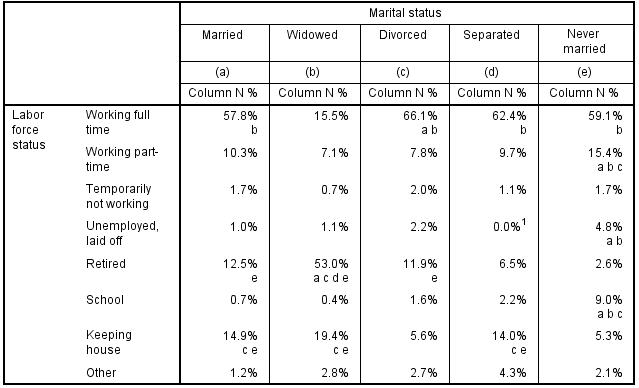
- Double-click the table in the Viewer window to activate it.
- Hover over one of the column labels cells that contain the letter keys. For example, hover over
the cell with the label "(a)".
Figure 4. Highlighting all cells that contain the selected letter key 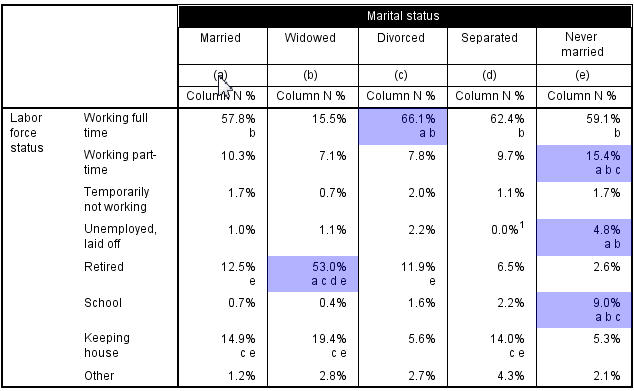
All cells that contain that key are highlighted in the table.
- Right-click the column label cell with the letter key. From the context menu choose .
Figure 5. Selecting all cells that contain the selected letter key 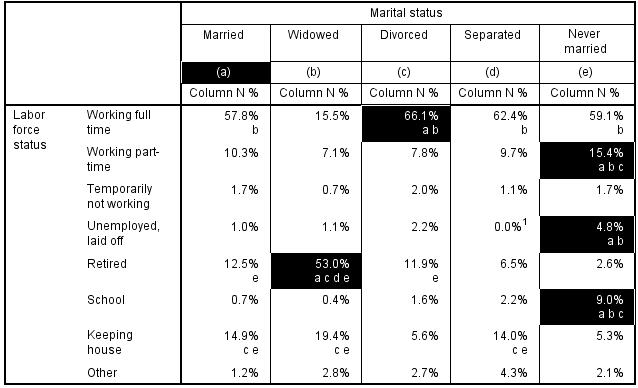
All cells that contain that key are selected in the table.