Confidence Intervals
This example uses the data file survey_sample.sav. See the topic Sample Files for more information.
Confidence intervals and standard errors are available for many table statistics.
- From the menus, choose:
- In the table builder, move Highest degree to the row area of the canvas pane.
- Click Summary Statistics...
- In the Statistics list in the Summary Statistics dialog, click the icon next to Count to expand the list of count-related statistics.
- Move the following statistics to the Display area: Column N%, Lower CL for Column Count %, Upper CL for Column Count %, and Standard Error of Column Count%.
- In the Confidence Intervals group, for Level (%), enter 99.
- Click Apply to Selection, and then click Close.
- Click OK to create the table.
Figure 1. Table of counts, column percentages, and confidence intervals 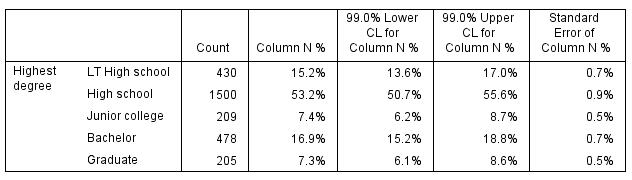
- Recall the Custom Tables dialog and click Summary Statistics...
- For the lower confidence limit, change the label to "Lower Confidence Limit (&[Confidence Level])". The string "&[Confidence Level]" inserts the value of the specified confidence level at that location in the label.
- Click Apply to Selection, and then click Close.
- Click OK to create the table.
Figure 2. Table with modified confidence interval label 