Running a linear regression on factor component scores
Using the Factor Analysis procedure, we can create a set of independent variables that are uncorrelated and fit the dependent variable as well as the original independent variables.
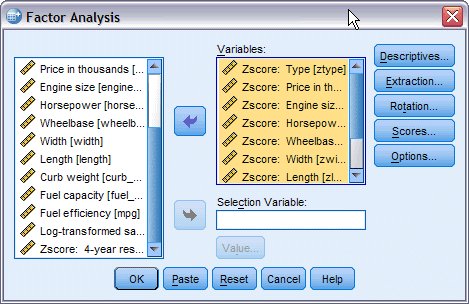
- To run a Factor Analysis on the standardized variables, from the
menus choose:
- Select Zscore: Vehicle type through Zscore: Fuel efficiency as analysis variables.
- Click Extraction.
Figure 2. Extraction dialog box 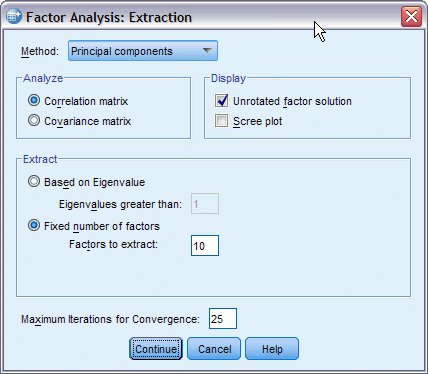
- In the Extract group, select Fixed number of factors and type 10 as the number of factors to extract.
- Click Continue, then click Rotation in the Factor Analysis dialog box.
Figure 3. Rotation dialog box 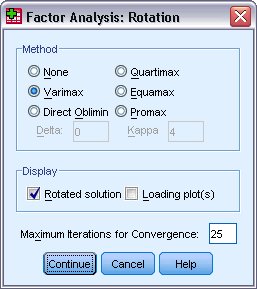
- In the Method group, select Varimax.
- Click Continue, then click Scores in the Factor Analysis dialog box.
Figure 4. Factor Scores dialog box 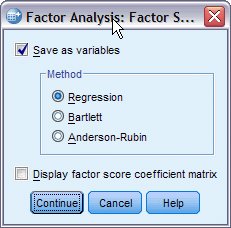
- Select Save as variables.
- Click Continue, then click OK in the Factor
Analysis dialog box.
Figure 5. Linear Regression dialog box 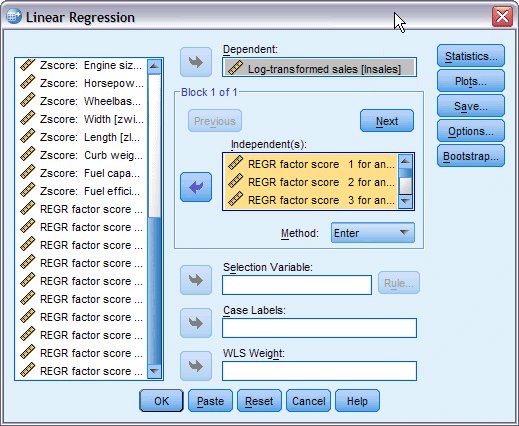
- To run a Linear Regression on the factor scores, recall the Linear Regression dialog box.
- Deselect Zscore: Vehicle type through Zscore: Fuel efficiency as independent variables.
- Select REGR factor score 1 for analysis 1 [FAC1_1] through REGR factor score 10 for analysis 1 [FAC10_1] as independent variables.
- Click OK.
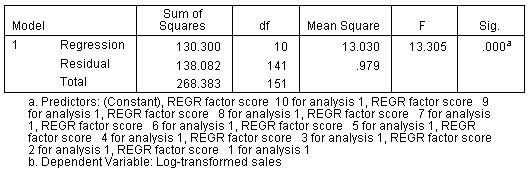
As expected, the model fit is the same for the model built using the factor scores as for the model using the original predictors.
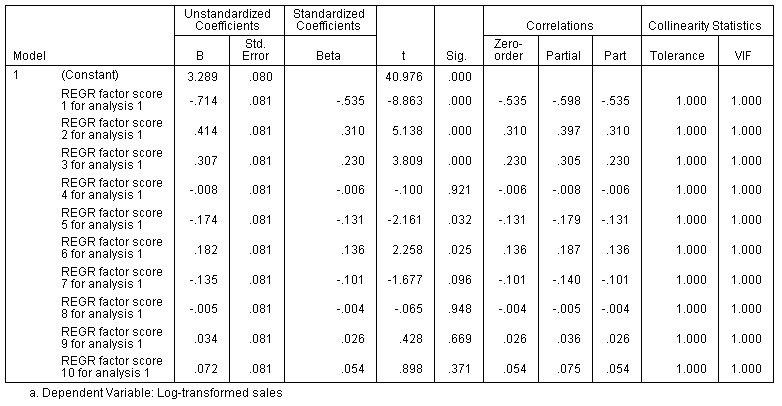
Also as expected, the collinearity statistics show that the factor scores are uncorrelated. Also note that since the variability of the coefficient estimates are not artificially inflated by collinearity, the coefficient estimates are larger, relative to their standard errors, in this model than in the original model. This means that more of the factors are identified as statistically significant, which can affect your final results if you want to build a model that only includes significant effects.