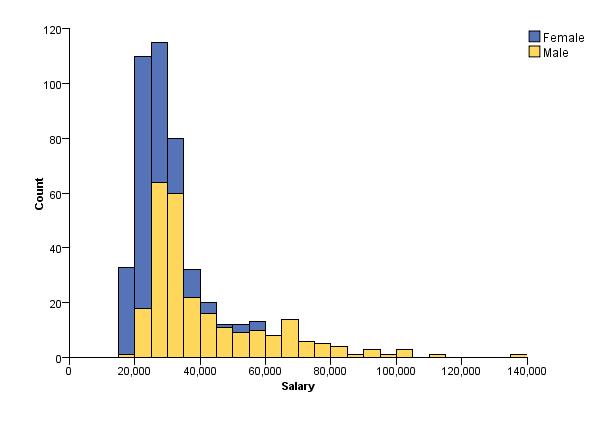
Stacked Histogram (GPL)
SOURCE: s = userSource(id("Employeedata"))
DATA: salary=col(source(s), name("salary"))
DATA: gender=col(source(s), name("gender"), unit.category())
GUIDE: axis(dim(2), label("Count"))
GUIDE: axis(dim(1), label("Salary"))
ELEMENT: interval.stack(position(summary.count(bin.rect(salary))),
                        color(gender))