Event types
Use this page to view the types of instrumentation event that a queue manager or channel instance can report
IBM® MQ instrumentation events have the following types:
- Queue manager events
- Channel and bridge events
- Performance events
- Configuration events
- Command events
- Logger events
- Local events
For each queue manager, each category of event has its own event queue. All events in that category result in an event message being put onto the same queue.
| This event queue: | Contains messages from: |
|---|---|
| SYSTEM.ADMIN.QMGR.EVENT | Queue manager events |
| SYSTEM.ADMIN.CHANNEL.EVENT | Channel events |
| SYSTEM.ADMIN.PERFM.EVENT | Performance events |
| SYSTEM.ADMIN.CONFIG.EVENT | Configuration events |
| SYSTEM.ADMIN.COMMAND.EVENT | Command events |
| SYSTEM.ADMIN.LOGGER.EVENT | Logger events |
| SYSTEM.ADMIN.PUBSUB.EVENT | Gets events related to Publish/Subscribe. Only used with Multicast. For more information see, Multicast application monitoring. |
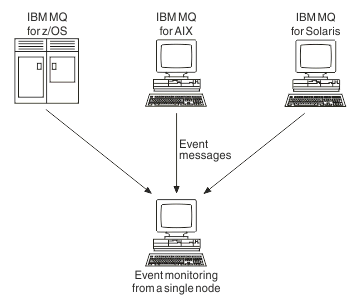
By incorporating instrumentation events into your own system management application, you can monitor the activities across many queue managers, across many different nodes, and for multiple IBM MQ applications. In particular, you can monitor all the nodes in your system from a single node (for those nodes that support IBM MQ events) as shown inFigure 1.

Instrumentation events also enable applications acting as agents for other administration networks, for example Tivoli® NetView® for z/OS®, to monitor reports and create the appropriate alerts.