Time-spent monitor elements
Time-spent monitor elements track how time is spent in the system. You can query them to see where time is spent waiting, or performing different types of processing. You can also view the elapsed time spent in a particular system component.

- Wait times
- Component processing times
- Component elapsed times.
- Wait times
- Wait-time monitor elements reflect the time that the database
manager spends waiting on something before it can proceed with processing.
Some examples include time spent waiting for the following services:
- Incoming client requests
- Locks on objects to be released
- Writing to the diagnostic log
- Reading from or writing to the buffer pool.
- Component processing times
- These times represent the time spent doing actual processing within
a specific logical component of the database. Some examples include
time spent doing the following services:
- Committing or rolling back transactions
- Performing database reorganizations
- Compiling SQL
- Loading data
- Performing runstats operations.
- Component elapsed times
- Component elapsed times reflect the total amount of elapsed time
spent within a logical component of the database. They include both processing
time and various types of wait times that might be incurred during
that overall stage of processing. For example, the overall time spent
doing a commit includes actual commit processing and might also include
various types of wait times, such as time incurred waiting for I/O
operations or log file operations to complete. Note: Elapsed time is not the same as elapsed time as measured on a clock; if the overall time spent was split among multiple threads, the time spent in each thread is represented in this number.Some examples of how you can use component times include:Examples of monitor elements that track overall component times include total_compile_time and total_commit_time
- Learning where relatively costly processing is taking place for a given workload (for example SQL compilation, as compared to query execution)
- Determining whether the cost of a specific component area can be attributed to actual processing, or whether wait time plays a significant role in reducing throughput
- Understanding the cost of a particular component area (for example, rollback processing) in the context of the overall time spent in the system.
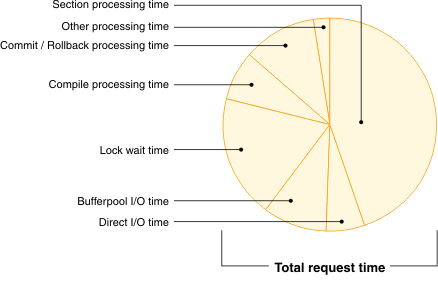
You can query component processing times and wait times to get a breakdown of specific wait times relative to processing times. Figure 1 is an example of how these two types of time-spent metrics can be viewed relative to one another.
While component elapsed times cannot be used to obtain a breakdown of specific types of wait times (for example, lock waits, I/O-related waits), they do provide an alternative view that you can use to view processing times relative to the overall time spent in a given logical database component. An example would be examining the ratio of actual processing time for table or index reorganizations (total_reorg_proc_time), to the overall elapsed time spent performing reorgs (total_reorg_time), which could include time spent on a variety of miscellaneous processing and waits not directly related to the reorg itself.